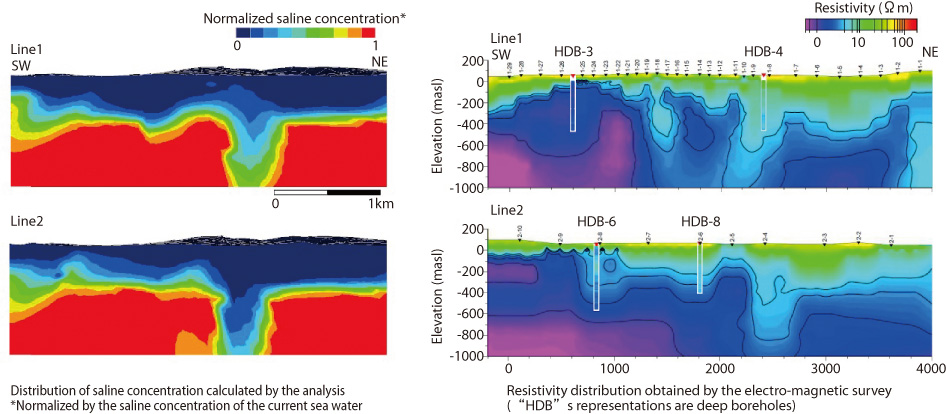
Fig.2-20 Distribution of saline concentration calculated by the GW flow and saline transport analysis (left)
and resistivity distribution obtained by the electro-magnetic (EM) survey (right)
Highly concentrated saline GW is considered to be replaced with the infiltrating water from precipitation. This occurs especially at high permeable zones (near a permeable fault) according to the analysis. Resistivity distribution obtained by the EM survey which reflects the distribution of saline concentration correlates with the results of this analysis.
Go back by your web browser, or click the right button. « Close