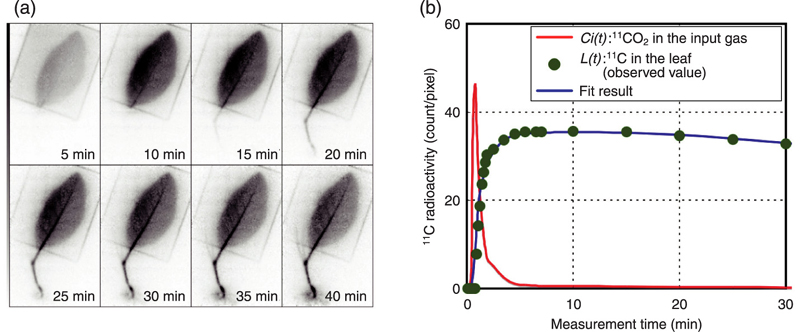
Fig.4-15 Serial PETIS images and a graph of the time-activity
(a) Serial images of carbon dynamics were acquired after 11CO2 exposure by PETIS. (b) Activity values of PETIS data over time (●) and the curve predicted by the model (─) are in good agreement.
Go back by your web browser, or click the right button. « Close