(a) |
(b) |
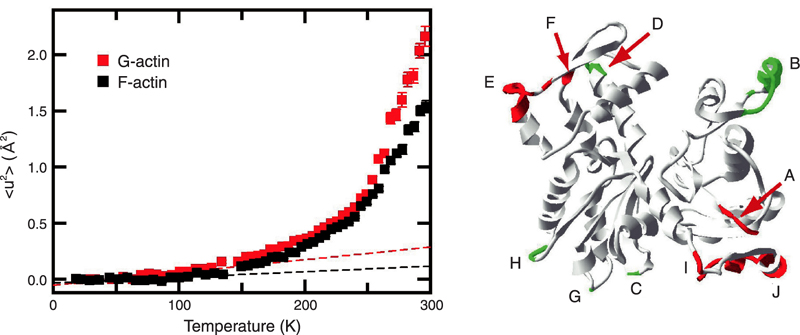
Fig.4-20
(a) Temperature dependence of the mean square displacements of actin in the monomeric state (G-actin) and polymerized state (F-actin) (b) Structure of the actin molecule. The regions shown in red or green denote the region showing large fluctuations. The fluctuations in the regions shown in green are considered to be suppressed by polymerization.
Go back by your web browser, or click the right button.« Close