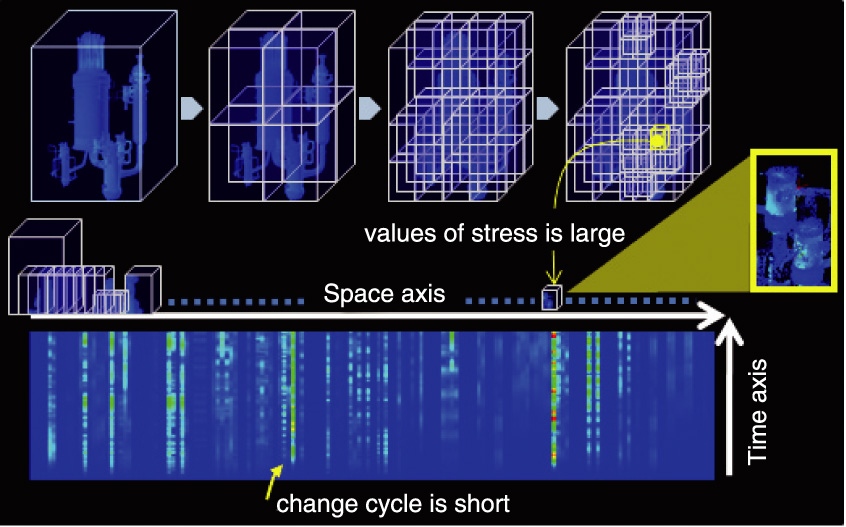
Fig.10-5 Visualization of results obtained from a vibration simulation of a nuclear facility
We show the use of our visualization technique for the analysis of the stress fluctuation in a vibration simulation of a nuclear facility after an earthquake. First, we put a three-dimensional model of the nuclear facility inside a hexahedron and then subdivide the hexahedron into smaller hexahedrons (upper part). Next, we define a space axis by arranging these smaller hexahedrons in one line. Further, we define a time axis perpendicular to the space axis and represent the values of stress by using a color scheme in the plane formed by these two axes (lower part). From this representation, we find time and space with a comparatively large stress (the right image surrounded by yellow lines).
Go back by your web browser, or click the right button.« Close