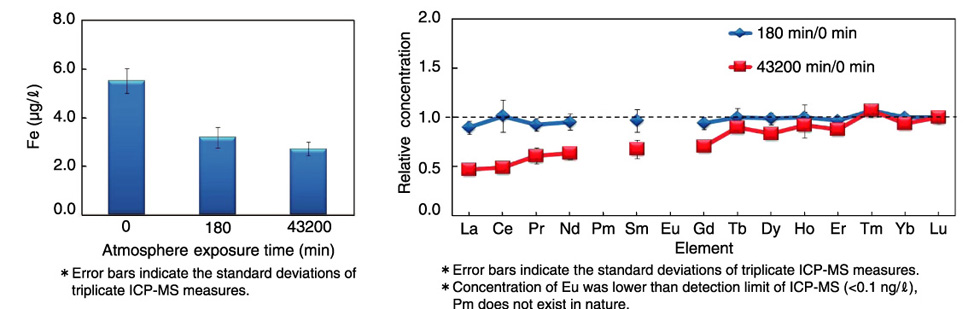
Fig.2-16 Concentration of Fe (left) and relative concentration of rare earth elements (right) in filtered groundwater at different atmosphere exposure times
The concentration of Fe decreased with the exposure time, suggesting that Fe in the groundwater aggregated on the filter by oxidation (left). The blue markers denote the data at 180 min normalized by the data at 0 min; red markers denote the data at 43200 min normalized by the data at 0 min. The concentration of the rare earth elements decreased with the exposure time, suggesting that the rare earth elements in the groundwater adsorbed onto the Fe colloids aggregated on the filter by oxidation (right).
Go back by your web browser, or click the right button.« Close