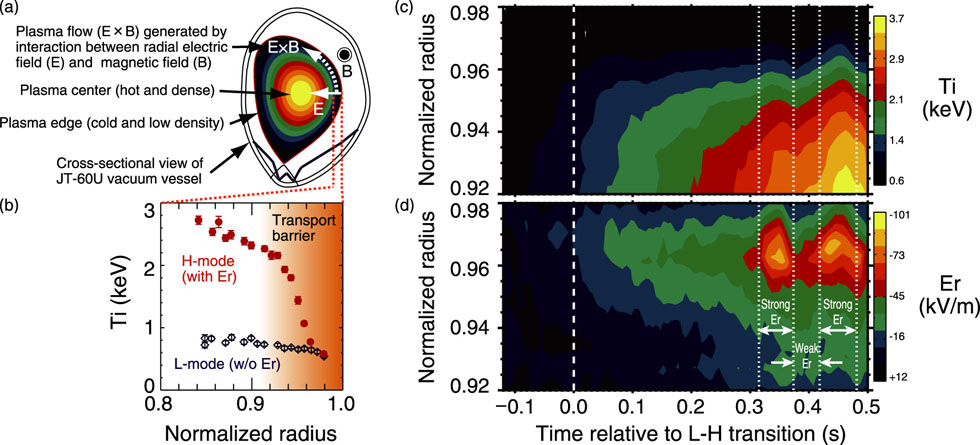
Fig.3-15 Cross-sectional view of plasma (a), an ion temperature profile (b), a contour plot of spatiotemporal structures of ion temperature Ti (c), and radial electric field Er (d)
In an improved confinement mode (H-mode), a transport barrier is formed. As expected from the theory, the Er profile (right bottom) is found to develop at and after the transition to the H-mode, indicating the formation of an edge “well” structure, and the steepening of the Ti profile is accelerated. During the formation of the pedestal, a spontaneously generated multistage Er transition is observed with essentially the same confinement properties, transiently. It is noted that normalized radii with values of zero and unity are defined by the plasma center and edge, respectively.
Go back by your web browser, or click the right button.« Close