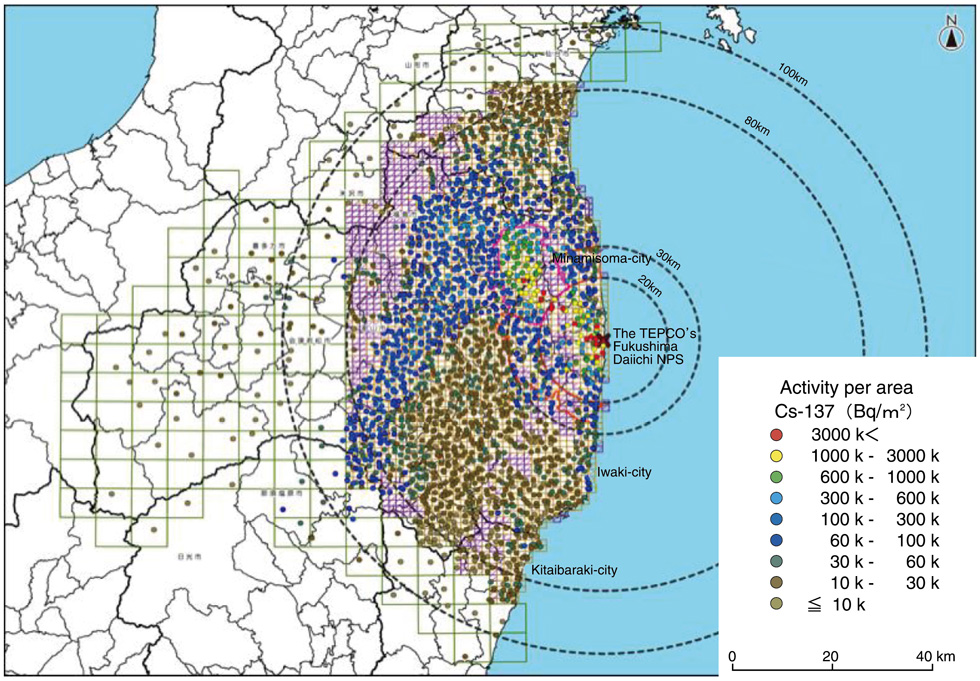
Fig.1-10 Cs-137 deposition map
Ranges of activity per area are shown by colors according to the results averaged over five samples collected at one location and normalized to that on June 14, 2011.
Go back by your web browser, or click the right button.« Close