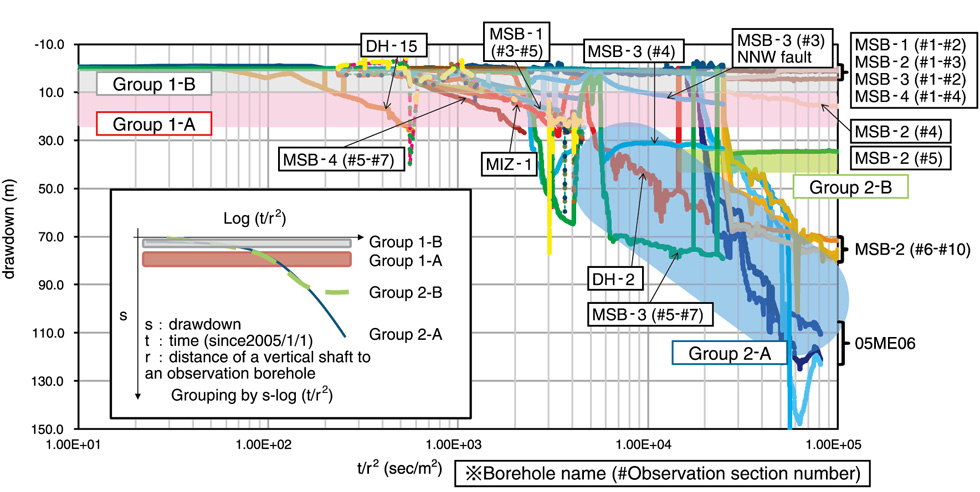
Fig.3-18 s(drawdown)-log(t/r2) plot
The x-axis is the logarithm of t/r2 and the y-axis shows the drawdown in each observation section.
Group 1-A exhibits a small amount of drawdown. Group 1-B does not exhibit obvious drawdown. Group 2-A exhibits a large amount of continuing drawdown. Group 2-B exhibits a large amount of drawdown, which has already been balanced.
Group 1-A exhibits a small amount of drawdown. Group 1-B does not exhibit obvious drawdown. Group 2-A exhibits a large amount of continuing drawdown. Group 2-B exhibits a large amount of drawdown, which has already been balanced.
Go back by your web browser, or click the right button.« Close