Fig.3-19 Borehole grouping based on s-log(t/r2) plots (section view, plan top view)
Go back by your web browser, or click the right button.« Close
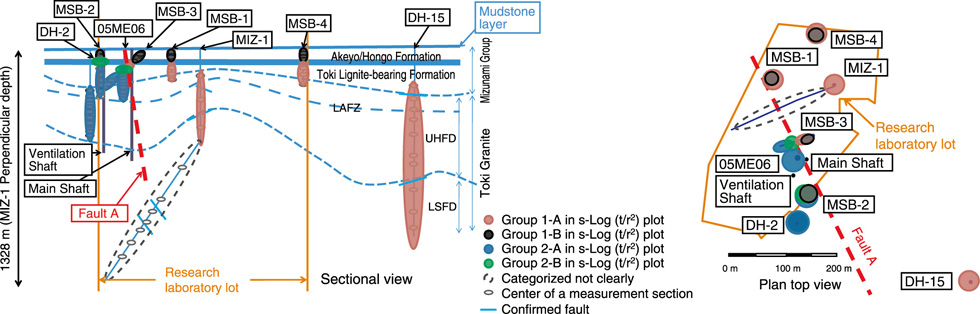
Fig.3-19 Borehole grouping based on s-log(t/r2) plots (section view, plan top view)
Go back by your web browser, or click the right button.« Close