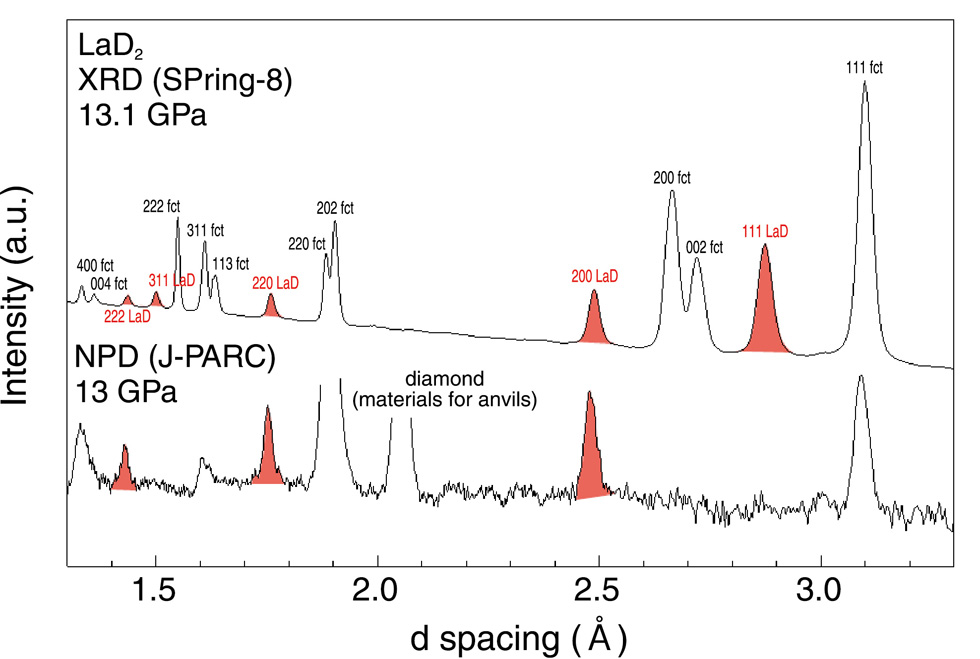
Fig.5-13 SR XRD (upper) and NPD (lower) profiles after phase separation of LaD2 at 13 GPa
Intensities are on a logarithmic scale in arbitrary units. The reflection peaks of LaD are shown in red.
Go back by your web browser, or click the right button.« Close