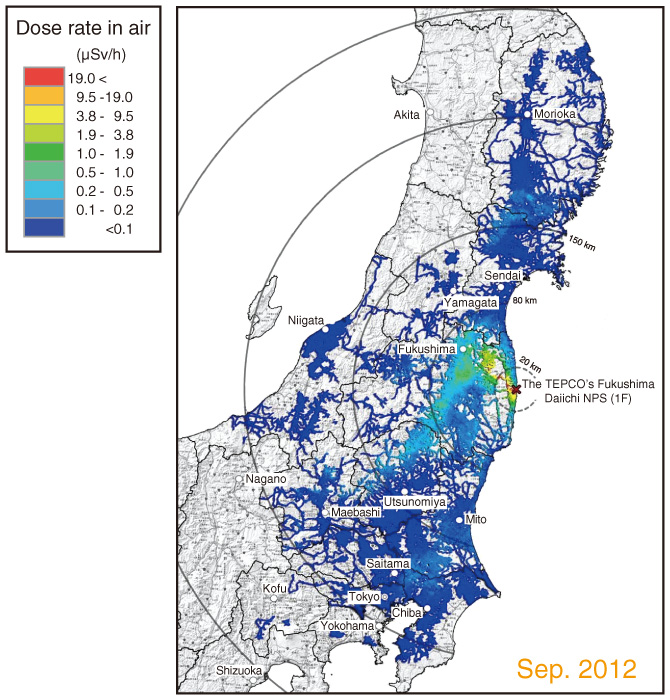
Fig.1-5 Example of large-scale car-borne survey data using KURAMA
Air dose rates measured every 3 seconds on roads are averaged in 100 m squares, and dose rate ranges are shown by different colors.
Go back by your web browser, or click the right button.« Close