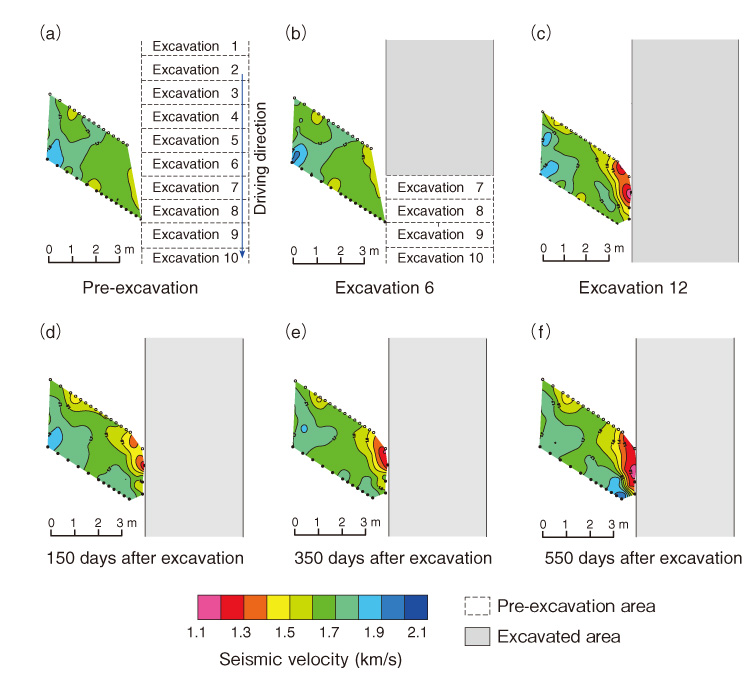
Fig.3-11 Results of seismic tomography survey
These figures show the velocity contour maps at each investigation stage.
Go back by your web browser, or click the right button.« Close
Fig.3-11 Results of seismic tomography survey
Go back by your web browser, or click the right button.« Close