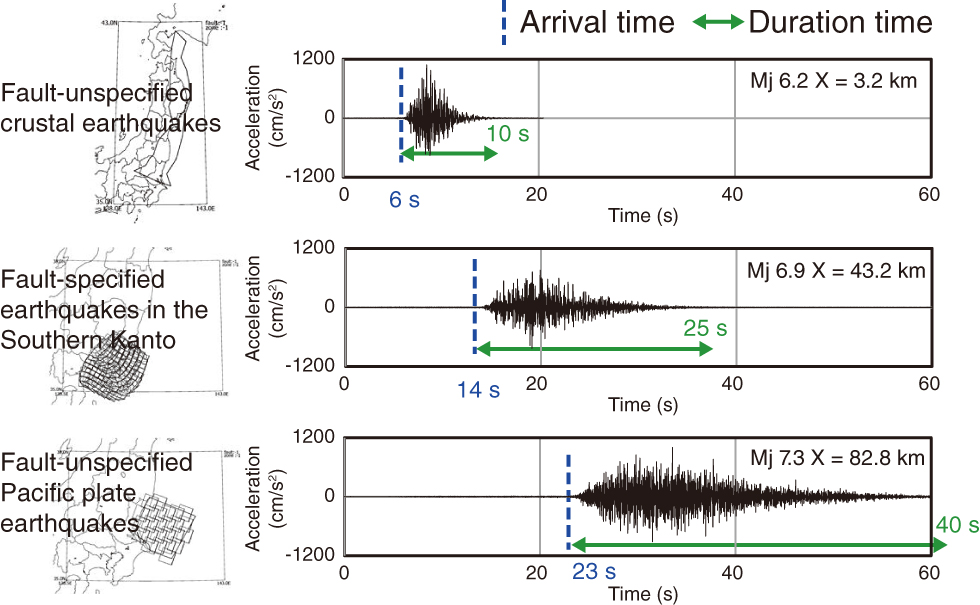
Fig.10-5 Example time histories of reproduced GMs
The GMs in this figure are for the same hazard level; however, it can be seen that GMs reproduced from different faults show different GM properties. (Mj: Magnitude of earthquake, X: Distance from seismic source)
Go back by your web browser, or click the right button.« Close