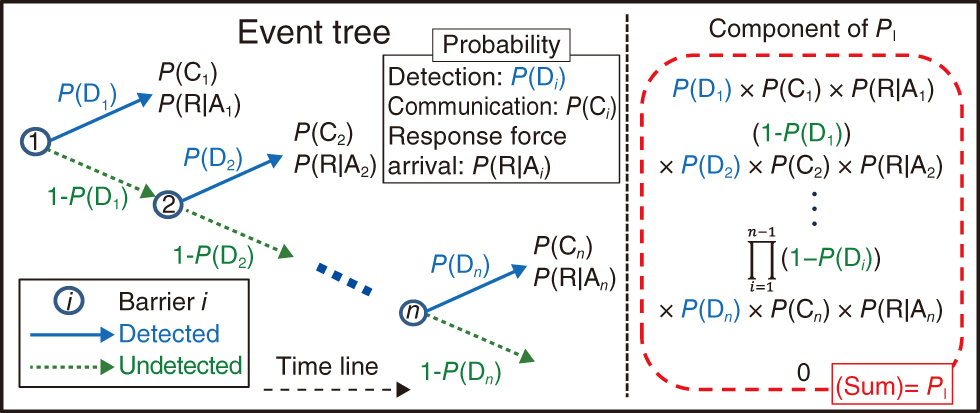
Fig.11-2 Schematic of the EASI method
The left side indicates a simplified event tree diagram at the i point barriers, and the right side indicates the calculation components of PI. PI is the total probability of these calculation components.
Go back by your web browser, or click the right button.« Close