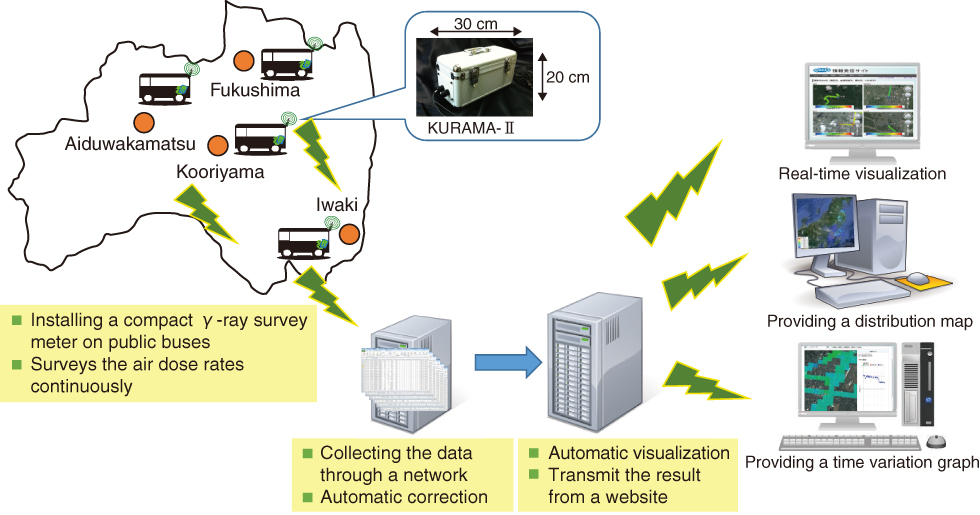
Fig.1-12 A real-time visualization system for the distribution of air dose rates in the Fukushima Prefecture
By installing a compact γ-ray survey system on public buses, survey data will be collected, compensated, visualized automatically, and finally made available to the public.
Go back by your web browser, or click the right button.« Close