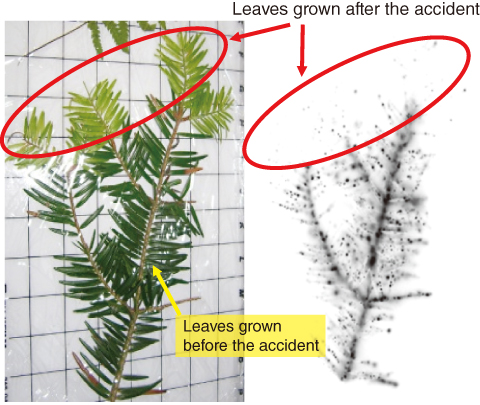
Fig.1-16 Autoradiograph (AR) image of Torreya nucifera sampled after 2 months of the accident
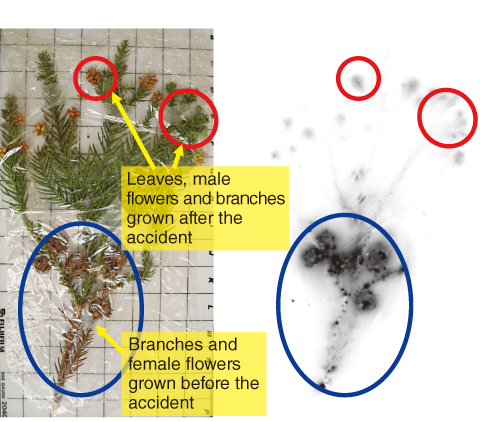
Fig.1-17 AR image of Cryptomeria japonica sampled after about 2 years of the accident
How were radionuclides attached to and transported in forest plants and soil after the fallout from the accident at the TEPCO’s Fukushima Daiichi NPS? This question must be resolved to quantify present and future forest contamination. Distributions of radionuclides in plants and soil samples are usually measured by cutting small fractions from the samples. Unfortunately, this technique requires considerable time and effort. Thus, we have applied an autoradiography technique to analyze the distribution of radionuclides within the plants and soil.
We collected Torreya nucifera and Cryptomeria japonica samples in Iitate-mura, Soma-gun, Fukushima in May 2011 and Okuma-machi, Futaba-gun, Fukushima in December 2012, respectively. We placed the samples on an imaging plate (IP) coated with fluorescent paint that reacts with radiation and photographed the spatial distribution of radionuclides. The distribution of radionuclides in the branches and leaves of T. nucifera (Fig.1-16(left)) was analyzed by autoradiograph (AR) images, where many black spots were present (Fig.1-16(right)). These black spots appeared on IP in response to radiation originating from radioactive Cesium (Cs). Note that 131I was decayed out in May. Fig.1-16(left) illustrates dark and light green leaves that grew before (old) and after (young) the accident, respectively. Black spots were present on the dark green leaves but not on the light green leaves, indicating that radionuclides attached to the old leaves were rarely transported to the young leaves. The same result was obtained from analysis of Cryptomeria japonica.
The AR image (Fig.1-17(right)) in C. japonica (Fig.1-17(left)) shows many black spots on the branches and the female flowers that emerged before the accident. On the contrary, broadened black areas were observed on the leaves and female flowers that emerged after the accident, indicating that radioactive Cs was translocated from the tree surface to the new branches and leaves. Since the top of the leaves and male flowers are actively growing, and since K ions are known to be accumulated in the active areas, radioactive Cs may have been transported from the old branches to the newer area.
These results clearly show that radioactive Cs deposited on the tree surface is slowly translocated to new growing areas over timescales of the order of years.

