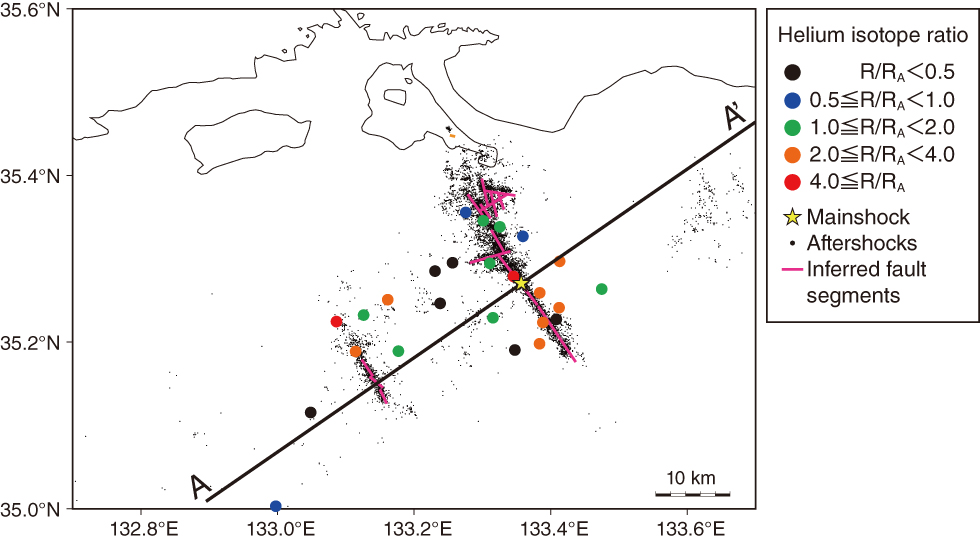
Fig.8-23 Geographical distribution of helium isotope ratios in aftershock area of 2000 western Tottori earthquake
The helium isotope ratios in the aftershock area decrease with distance from the inferred faults.
Go back by your web browser, or click the right button.« Close