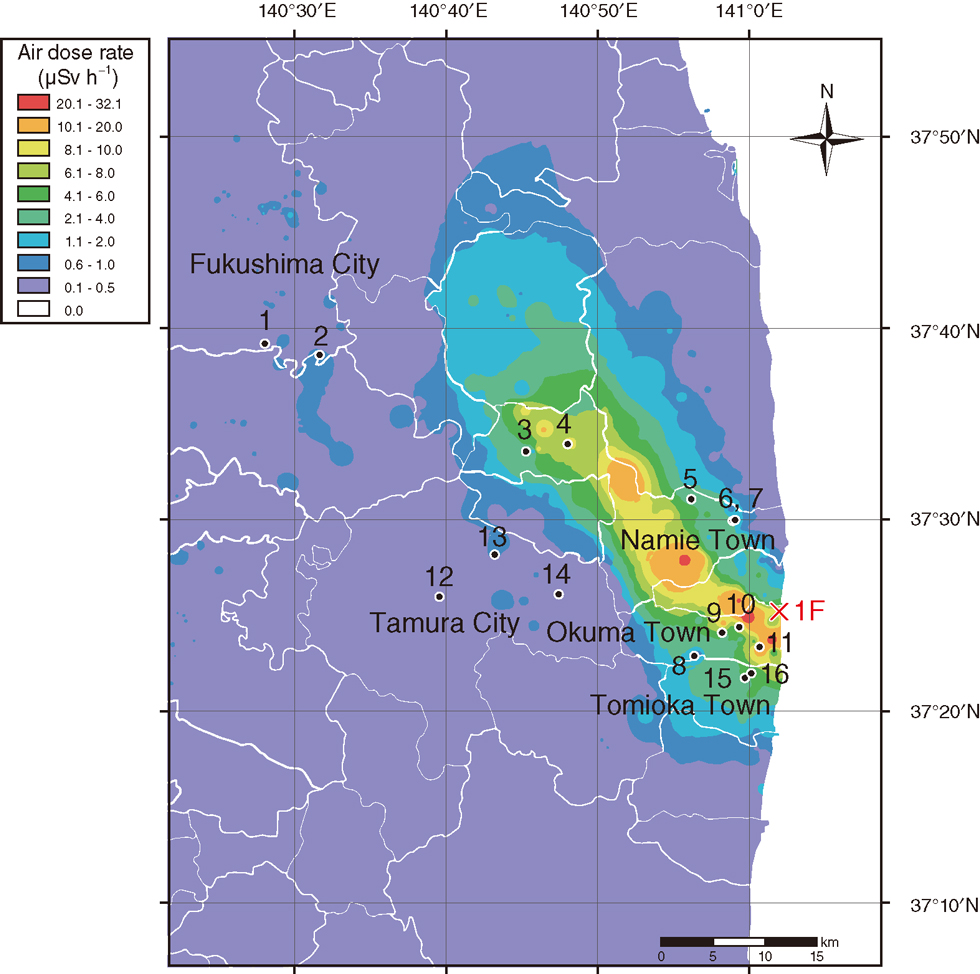
Fig.1-7 Locations of lichen sampling points superimposed on a distribution map of the air dose rate
The air dose rate was measured by MEXT in June and July 2011. A number of lichen samples were collected at each sampling point.
Go back by your web browser, or click the right button.« Close