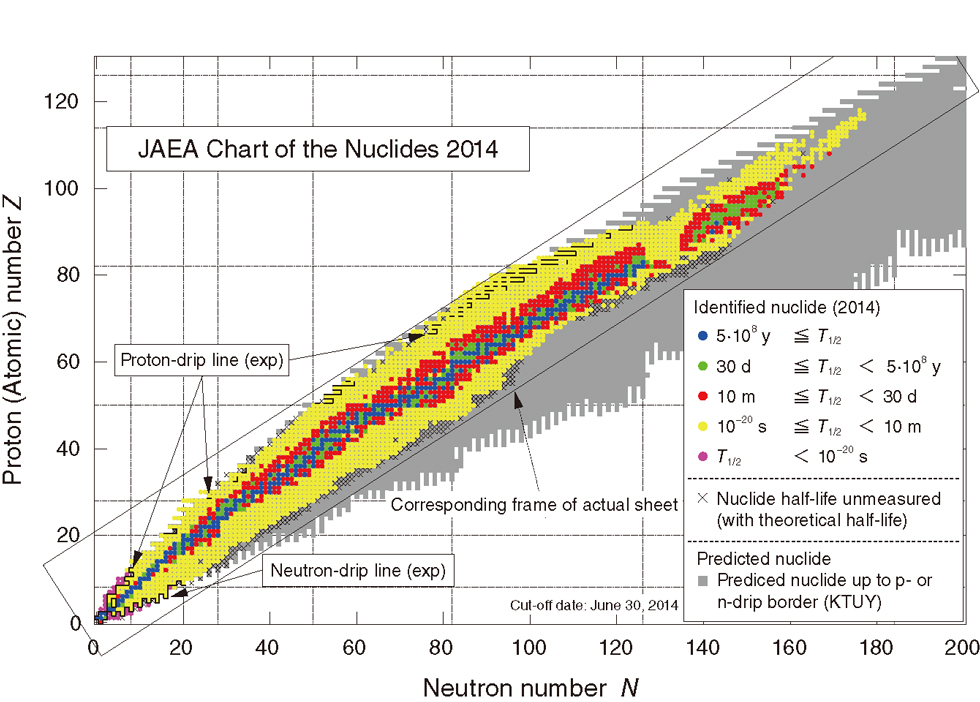
Fig.3-12 Overview of the JAEA Chart of the Nuclides 2014
Vertical axis: number of protons (atomic number); horizontal axis: number of neutrons. Colored non-gray nuclei indicate experimentally identified nuclides (3150); the region of the slanted rectangle corresponds to the main part of the chart. The gray region indicates nuclides whose existence has been theoretically predicted through calculation with the Koura-Tachibana-Uno-Yamada (KTUY) mass model, which was developed at the Advanced Science Research Center (ASRC) with collaborators.
Go back by your web browser, or click the right button.« Close