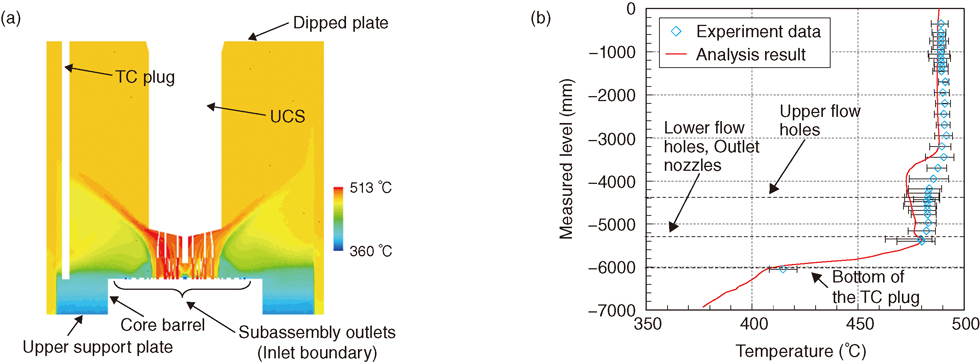
Fig.7-19 Analytical results of the temperature distribution
In (a), lower temperature sodium stagnated over the upper support plate. In (b), the analysis results were compared with the temperature measured along the TC plug. The analysis results agreed well with the measured data within the error bars.
Go back by your web browser, or click the right button.« Close