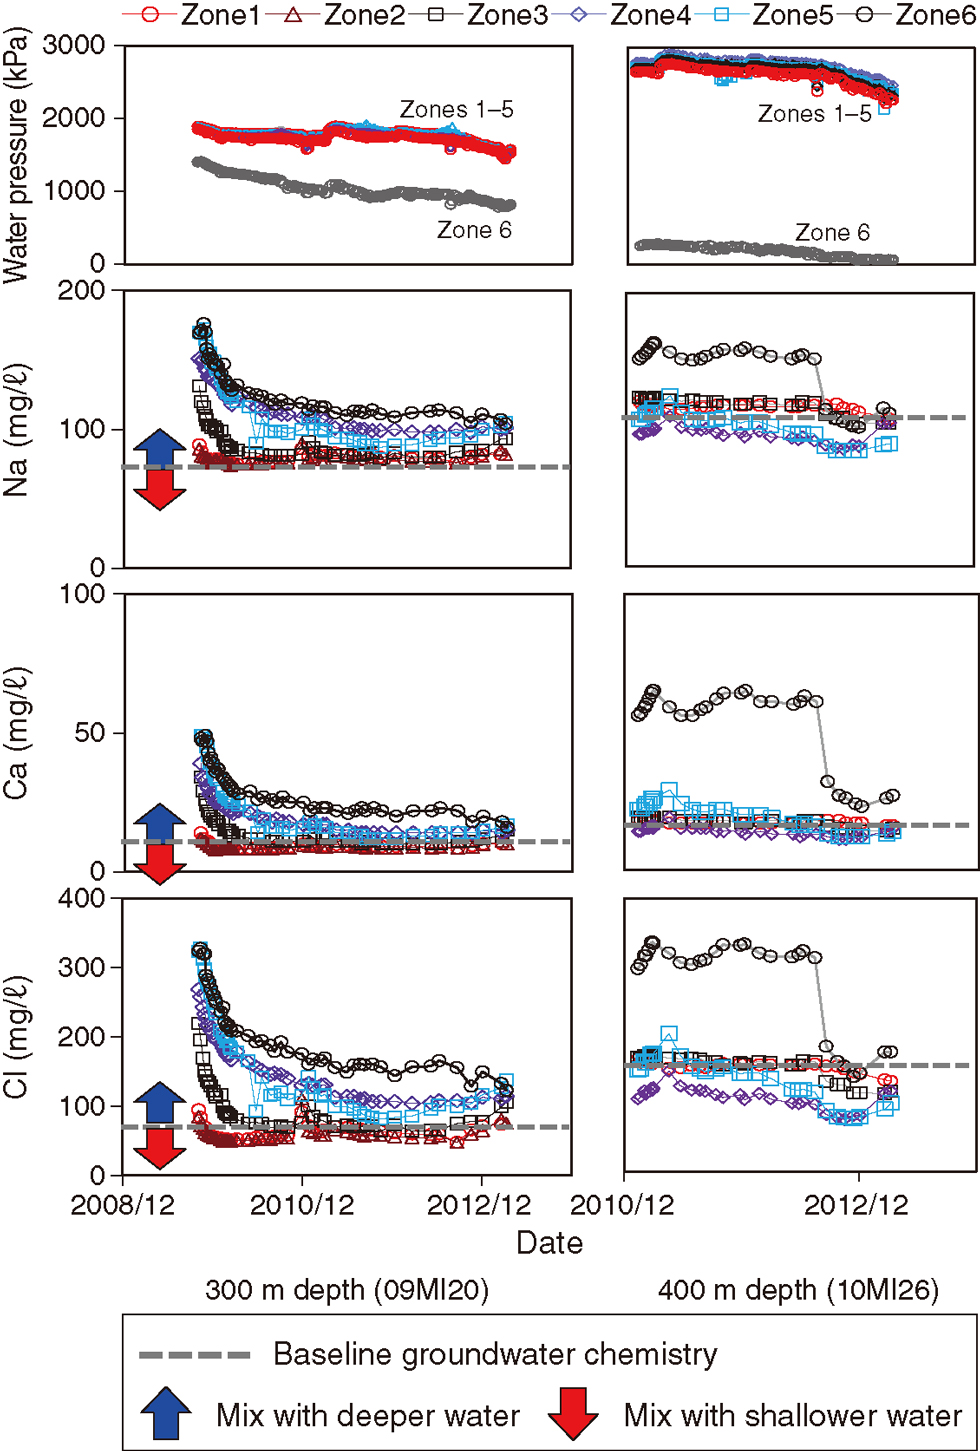
Fig.8-13 Changes of water pressure and chemistry with time at depths of 300 m and 400 m
Groundwater chemistry has been changing according to the distance from gallery in response to the drawdown.
Go back by your web browser, or click the right button.« Close