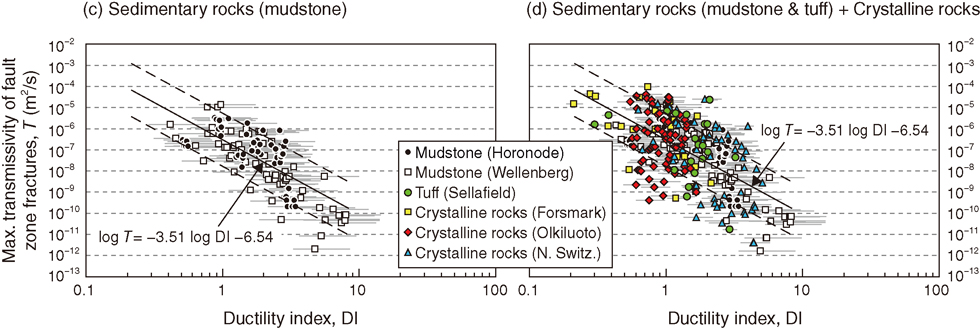
Fig.8-21 Relation between the maximum transmissivities of fault zone fractures and ductility index values
Solid lines show the power law approximation, and the equation is shown in the figures. Broken lines show the standard error (±1.25 in log T). Gray horizontal bars show estimation errors.
Go back by your web browser, or click the right button.« Close