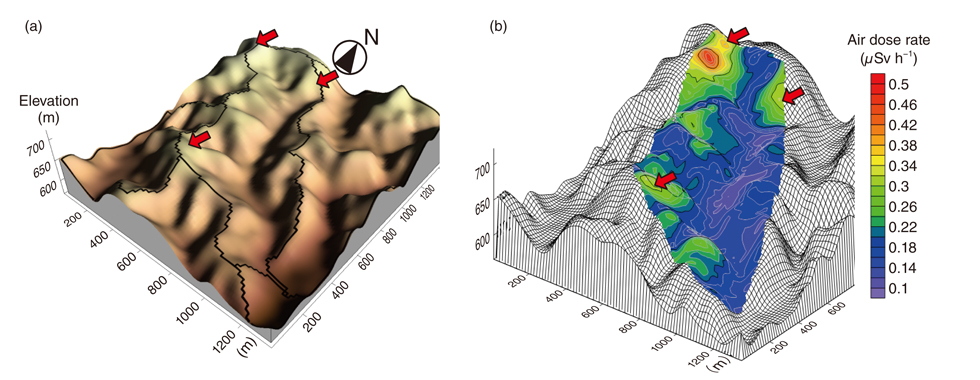
Fig.1-30 (a) A topographical map with a bird’s-eye view and (b) a three-dimensional contour map of the air-dose rate of the forest catchment
The catchment area bounded by the lines in panel (a) was investigated. The higher and east-facing slopes are colored more lightly because the map is lit from the east. (b) The spatial pattern of the air-dose rate is similar to the lighting pattern on the topographical map, indicating that more radioactive Cs was deposited on the ridges, shown as lines in panel (a) (e.g., the points indicated with red arrows), and east-facing slopes. This study showed that the spatial distribution of radioactive Cs deposition was strongly affected by topographical features.
Go back by your web browser, or click the right button.« Close