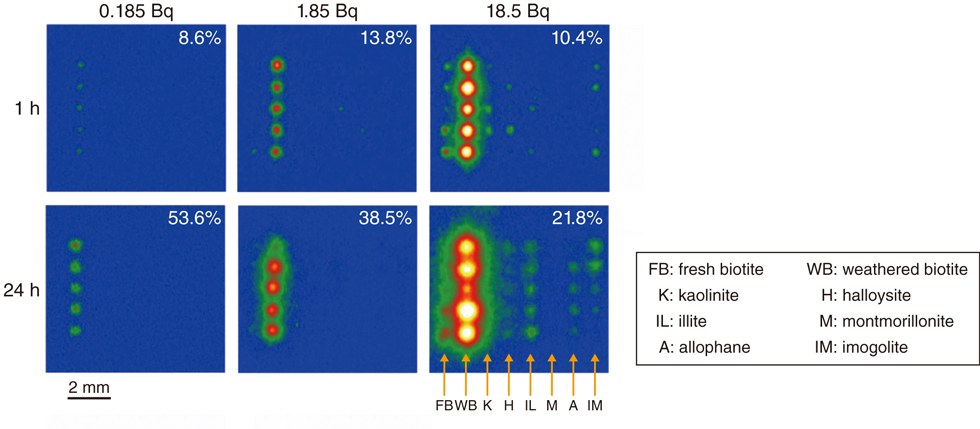
Fig.1-31 Read-out images of IPs with particles of various minerals adsorbing 137Cs from the solutions
The radioactivity input to the solution and reaction time are at the top and left, respectively. The figure at the top right of each image is the percentage of radioactivity adsorbed to all mineral particles, as estimated from the IP signal.
Go back by your web browser, or click the right button.« Close