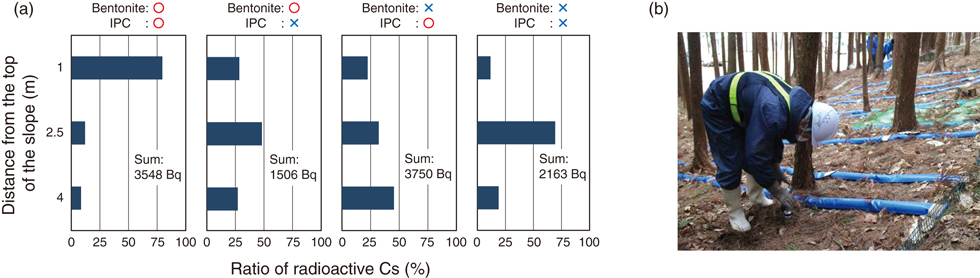
Fig.1-37 (a) Distribution of radioactive Cs on the slope after three months and (b) Appearance of soil-core sampling on the slope
The abundance ratios of radioactive Cs on the slope at the upper (1 m), middle (2.5 m), and lower (4 m) positions on the four lanes below the leaf-mold zone is indicated using a bar chart, showing a photo of soil-core sampling at each position.
Go back by your web browser, or click the right button.« Close