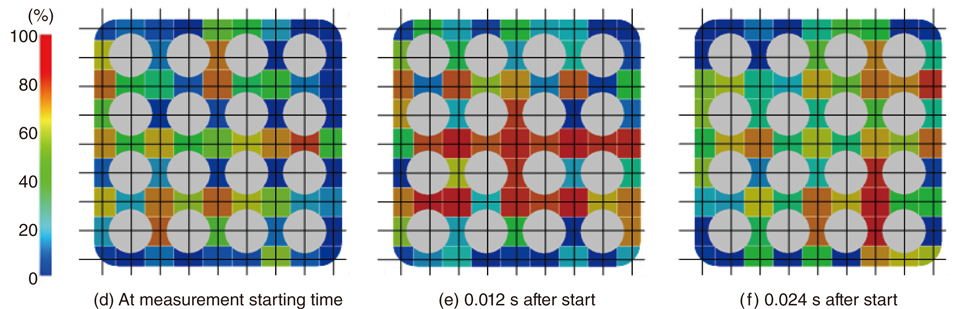
Fig.4-20 Changes in the measured steam volumetric-fraction distribution with time
These figures show the measurement results at pressure = 2.6 MPa, temperature = 226°C, water velocity = 0.58 m/s, and steam velocity = 1.74 m/s. The high-steam-volumetric-fraction region appears in the central part of the test channel (e); however, it becomes low (f). These figures show that the steam volumetric-fraction distribution changes significantly over a short time.
Go back by your web browser, or click the right button.« Close