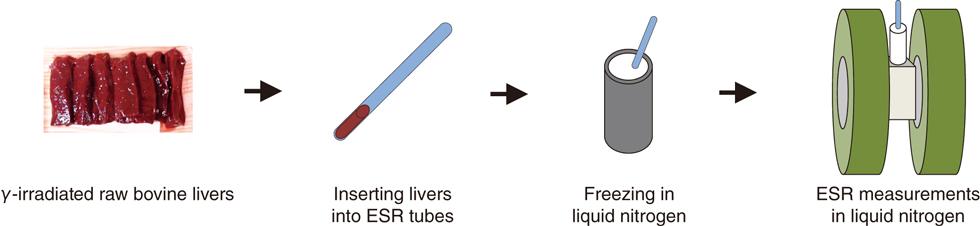
Fig.5-35 Schematic of electron spin resonance (ESR) measurements
Raw bovine livers were irradiated with 1.0, 2.6, 5.2, and 7.8 kGy γ-rays at 0 °C. The irradiated samples were inserted into ESR tubes, frozen at −196 °C with liquid nitrogen, and measured on an ESR at their frozen temperature.
Go back by your web browser, or click the right button.« Close