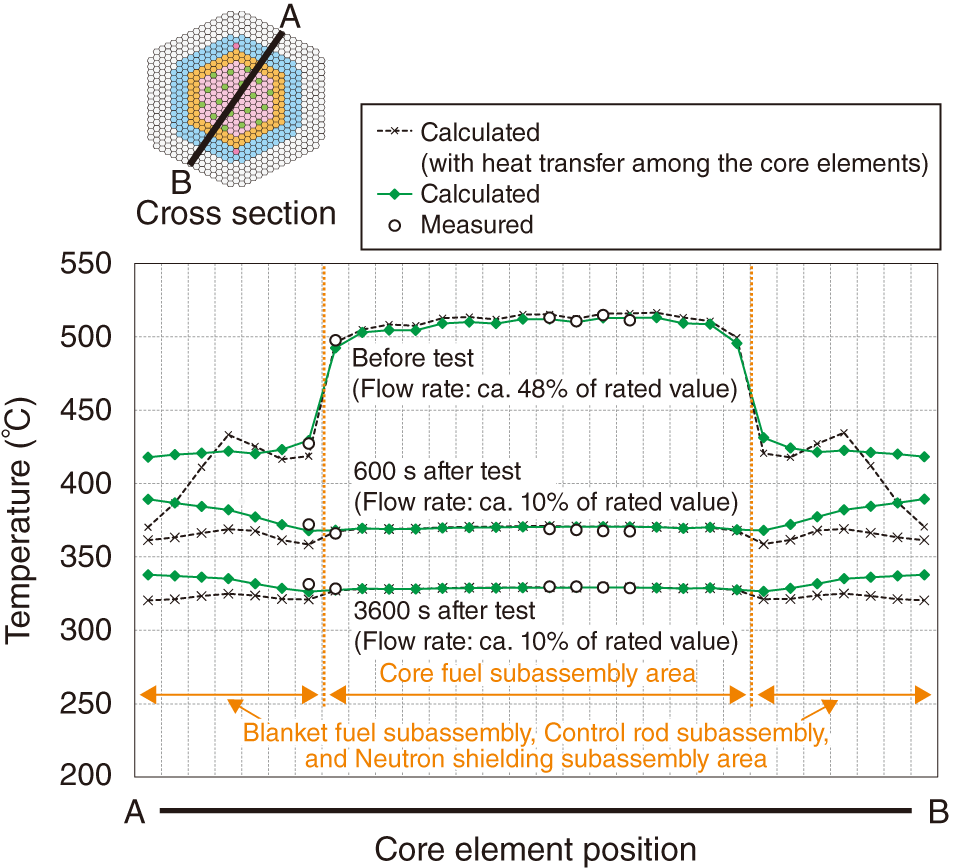
Fig.7-13 Comparison between the analytical result and the measured data
This figure shows the temperature distribution of the core-element outlet on the cross section shown in the figure. The outermost layer of the neutron shielding subassembly is adiabatic under the analytical condition. The analytical results agree well with measured values at each time.
Go back by your web browser, or click the right button.« Close