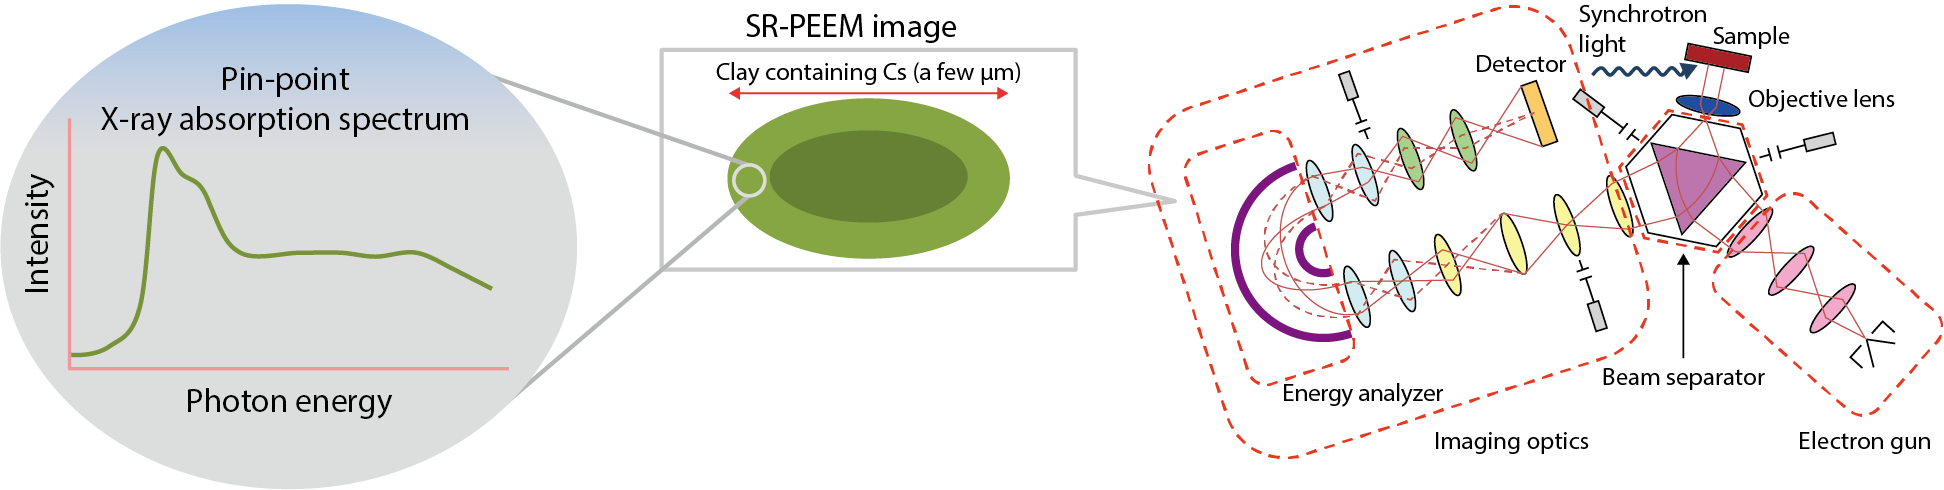
Fig.1-38 Diagram of nanoscale chemical analysis for Cs in clay particles
Images and pin-point X-ray-absorption spectrum obtained for each recorded position.
Go back by your web browser, or click the right button.Close
Fig.1-38 Diagram of nanoscale chemical analysis for Cs in clay particles
Go back by your web browser, or click the right button.Close