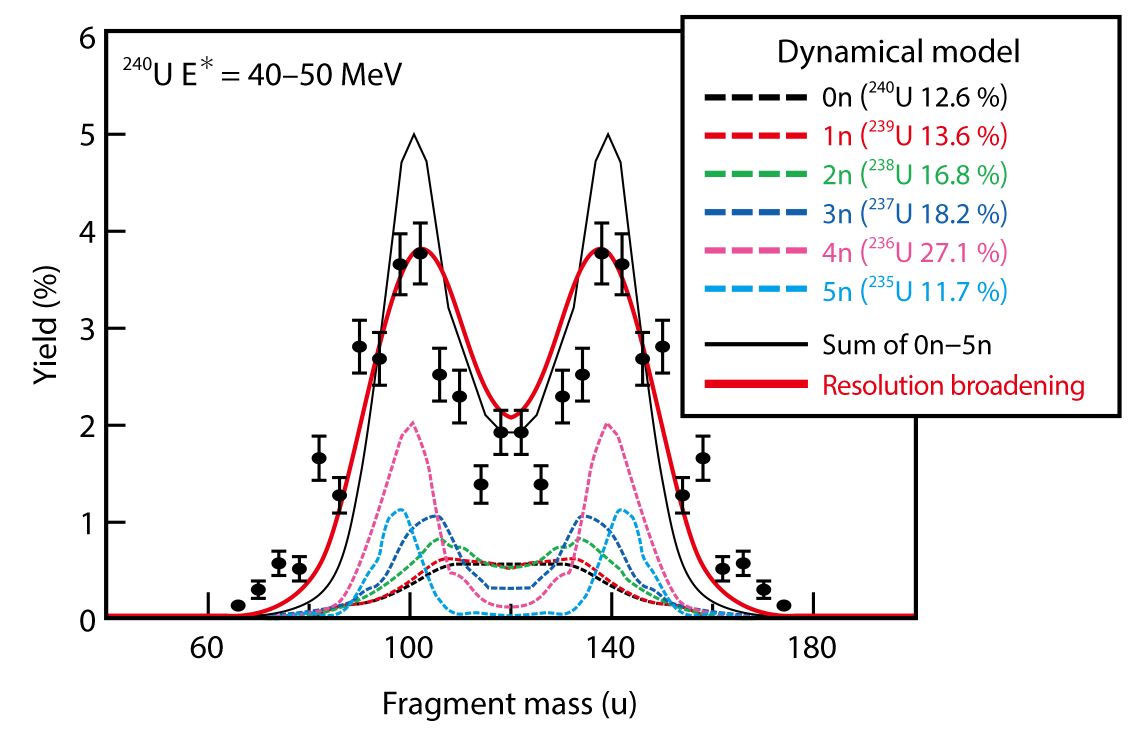
Fig.3-3 Nuclear splits in high-energy fission
The black plots show the observed nuclear splitting when a 240U nucleus is produced in the excitation energy range of E∗ = 40–50 MeV. The spectrum is contributed by six 235-240U nuclides produced by the emissions of 0–5 neutrons (dashed lines). These calculated fission fragment mass distributions (FFMDs) sum to the red curve, which well reproduces the experimental result.
Go back by your web browser, or click the right button.Close