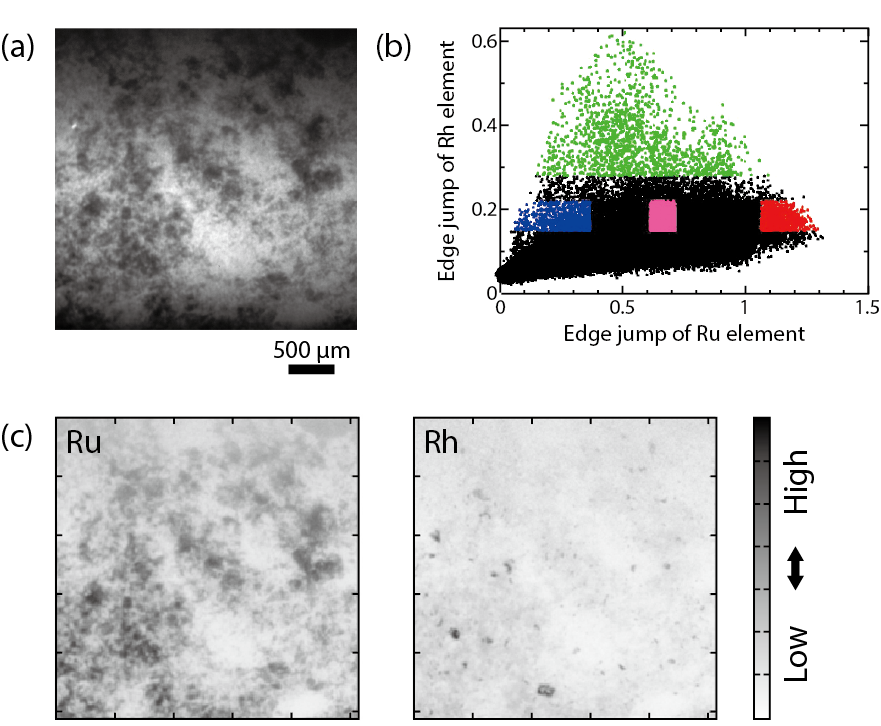
Fig.5-17 Distribution correlation between Ru and Rh elements in borosilicate glass
Imaging XAFS signals are obtained from the transmission X-ray image (a). The X-Y plot of absorption edge jumps corresponding to them (b) and the gray-scale mappings (c) are calculated from the imaging XAFS.
Go back by your web browser, or click the right button.Close