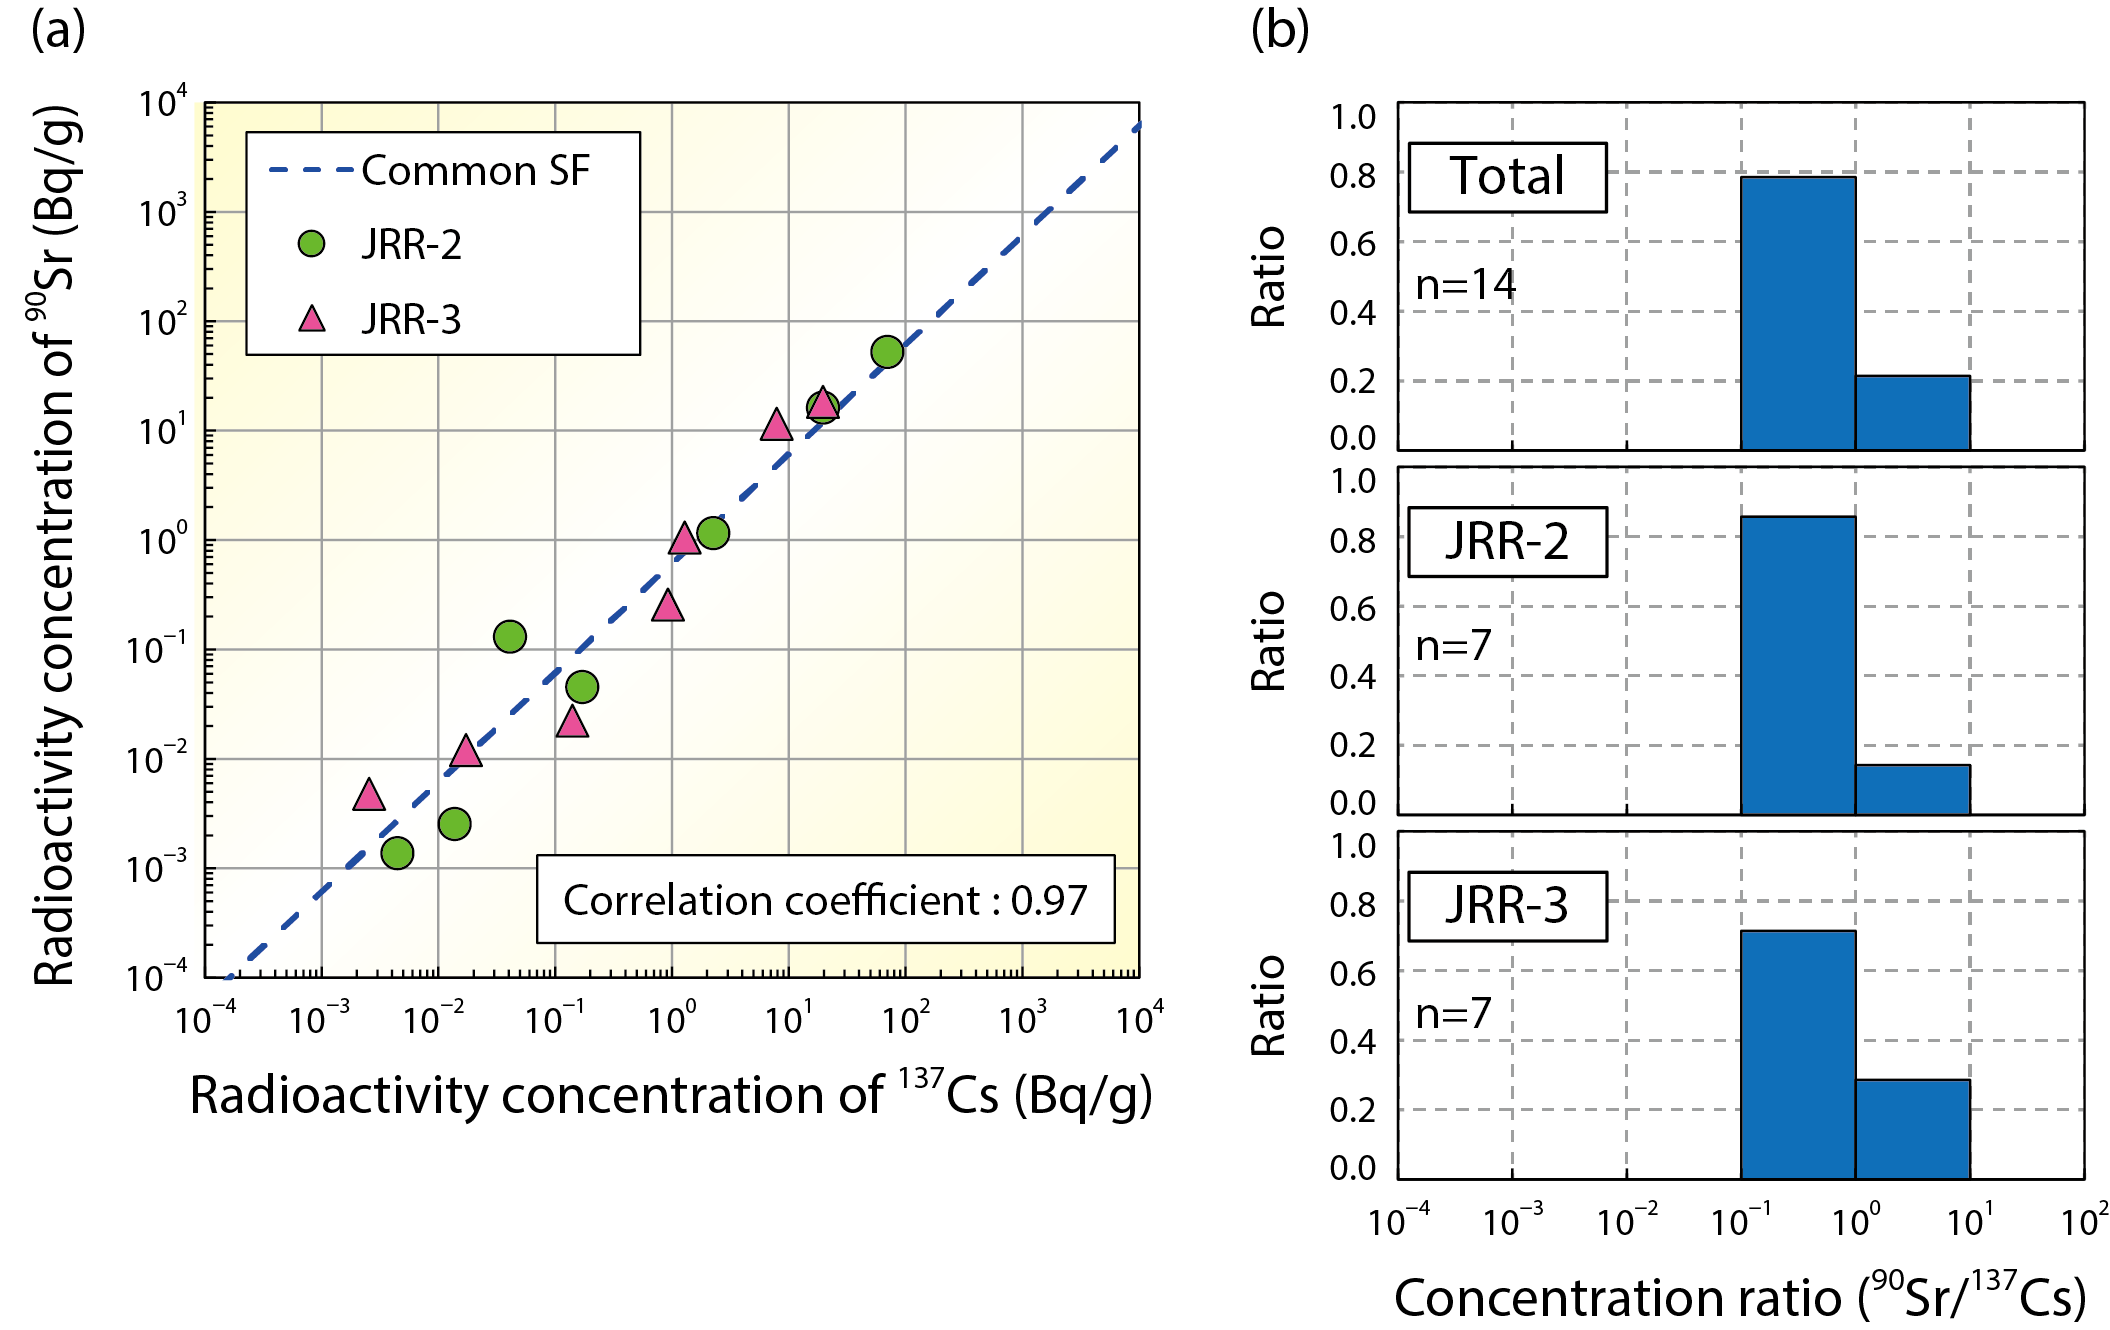
Fig.8-5 (a) Scatter diagram of the RCs of 90Sr and 137Cs in waste from the JRR-2 and the JRR-3; (b) RC ratio distribution for 90Sr/137Cs per facility
At JRR-2 and JRR-3, the correlation between the waste RCs of 137Cs and 90Sr is presented by a scatter diagram and the t-test (a). Their RC ratios are examined by the F-test (b). The result shows that the common SF for both JRR-2 and JRR-3 could be applied as shown in (a).
Go back by your web browser, or click the right button.Close