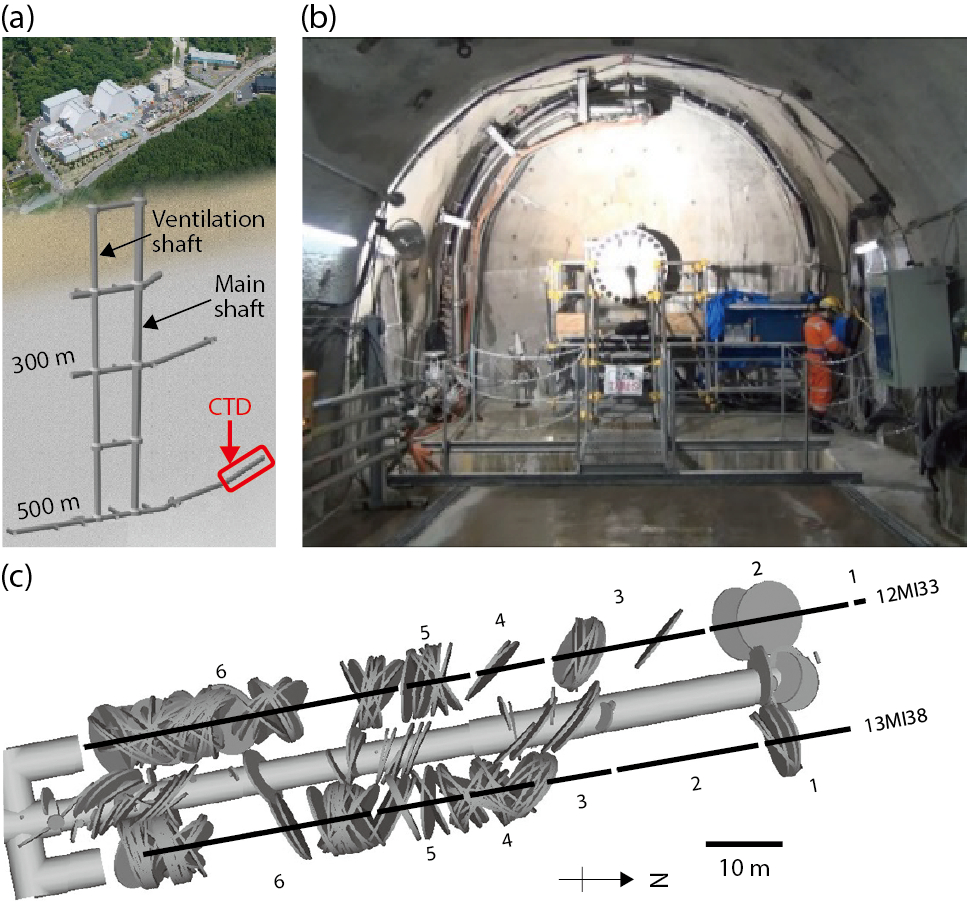
Fig.8-8 Schematic illustration of the Mizunami Underground Research Laboratory (MIU) and photograph of the water plug
(a) Schematic illustration of the MIU. The red square denotes the location of the Closer Test Drift (CTD). (b) Photograph of the water plug. (c) Positional relation between the CTD and the boreholes. Numbers along both boreholes denote the monitoring numbers.
Go back by your web browser, or click the right button.Close