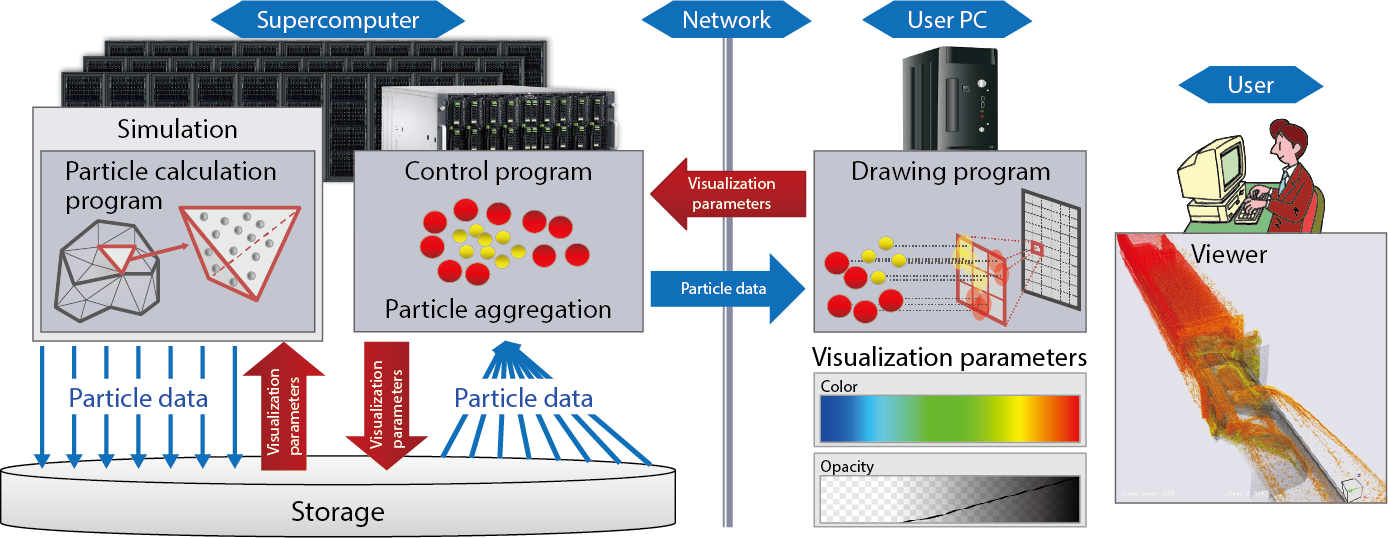
Fig.9-7 Constitution of In-Situ PBVR framework
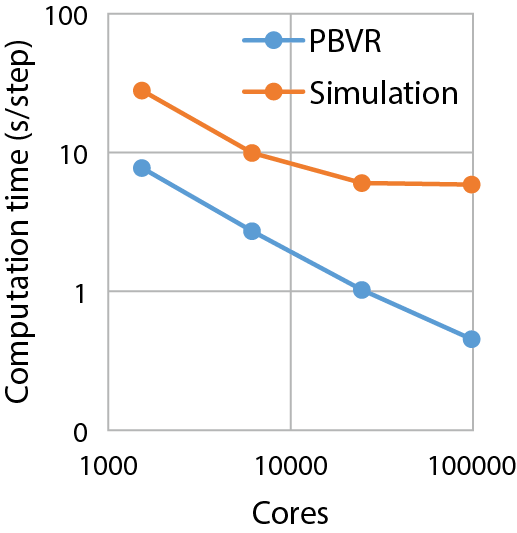
Fig.9-8 Performance on Oakforest-PACS
A supercomputer is formed when a large number of computing units are combined. It can execute a large-scale simulation by communicating calculation data among the computational units and generates data as a calculation result. Conventionally, the data are output to storage, and visualization analysis of the data is performed after simulation. However, the storage speed required for such an input/output process cannot keep up with the drastic improvement of supercomputer performance in recent years, and it has become difficult to apply conventional visualization methods to huge datasets (~ petabyte order). To avoid the data input/output problem, in-situ visualization, which executes visualization processing simultaneously with simulation and outputs a compressed visualization image (~ megabyte), is becoming increasingly prominent.
However, conventional in-situ visualization suffers from two drawbacks. First, every time the viewpoint is changed, communication between a large number of computing units occurs in order to render the anteroposterior relation of the polygons in the correct order. This communication time often exceeds the calculation time of the simulation and hinders it. Secondly, in conventional in-situ visualization, it is necessary to set the visualization parameters, namely viewpoint position, color, opacity, etc., beforehand, meaning that numerous simulations are needed to adjust these parameters.
To solve these problems, we have developed a new in-situ visualization framework “In-Situ PBVR” using particle-based volume rendering (PBVR) (Fig.9-7). PBVR converts simulation result data to particle data for visualization and drawing. Unlike polygon data, the order of PBVR’s particle data does not need to be rearranged; i.e., communication between computing units is unnecessary and the data size is extremely small. Utilizing this fact, we performed particle calculation without disturbing the simulation, with a viewpoint position that can be changed interactively by drawing particle data independent of the viewpoint on the user’s PC. Additionally, we created a mechanism that reflects visualization parameters that have been interactively adjusted by the user’s PC in the particle calculation via the supercomputer’s storage, and realized in-situ visualization that can adjust the visualization parameters interactively during the simulation’s runtime.
We combined the In-Situ PBVR with the heat-flow simulation inside the reactor pressure vessel and investigated the processing performance using the state-of-the-art supercomputer Oakforest-PACS. As shown in the performance evaluation in Fig.9-8, the particle-generation speed continued to accelerate even when the computing unit was increased from about 1500 to about 100000, and was suppressed within 8 %–28 % of the simulation speed. Particle data were transferred from Oakforest-PACS via the Internet, realizing interactive visualization.
This method won the 28th term Visualization Information Society Thesis Award.
<Previous: 9-3 | Next: 10 Development of Science & Technology for Nuclear Nonproliferation>

