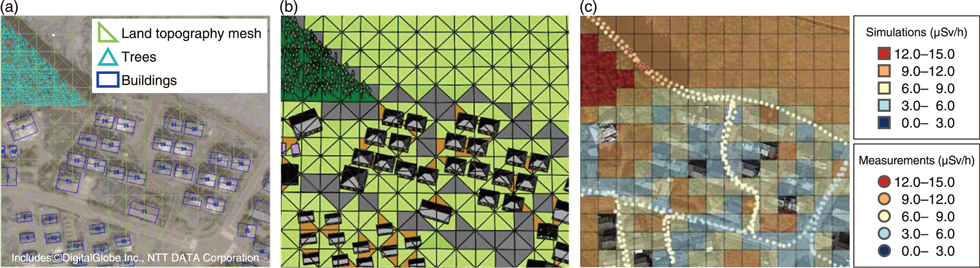
Fig.1-39 Process of modeling air dose rates with 3D-ADRES
(a) Selected areas in Fukushima Prefecture are modeled in 3D-ADRES using remote sensing data and satellite imagery. (b) Created models are converted into a format suitable for PHITS. (c) The air dose rate distribution is calculated by simulating the gamma rays emitted by radioactive cesium (134Cs and 137Cs). The colored squares represent modeled air dose rates, whereas the small colored circles represent air dose rates measured in a person-borne survey. Map imagery © DigiGlobe Inc., NTT Data, Google & Zenrin 2018.
Go back by your web browser, or click the right button.áClose