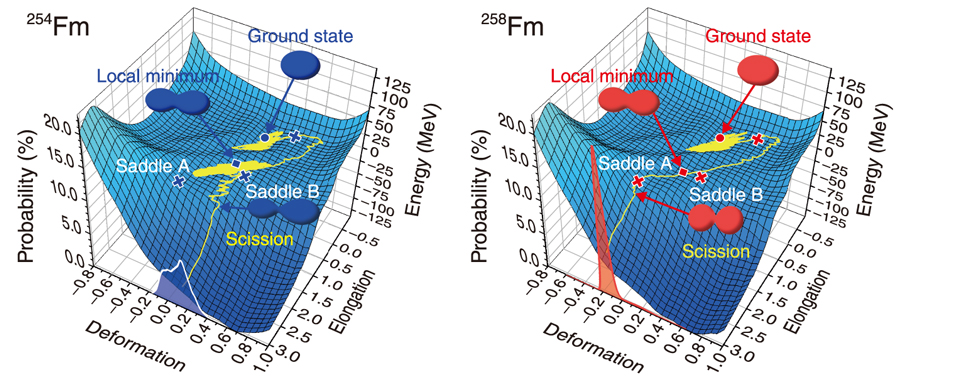
Fig.3-2 Shape evolution and fission for two fermium isotopes, 254Fm and 258Fm
Fission proceeds by passing through the local energy minima on the potential energy surface as shown by the yellow curve. Probability distribution on the deformation parameter at the scission point is shown.
Go back by your web browser, or click the right button.áClose