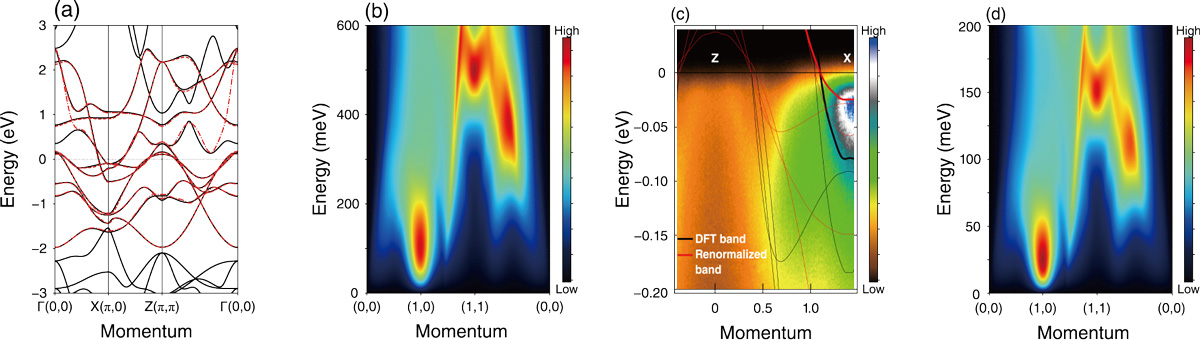
Fig.5-5 First-principles analysis of the spin excitation spectrum
(a) Electronic band structure of the iron-based superconductor obtained by first-principle calculations. (b) Spin excitation spectrum calculated using the model in Fig.5-5(a). (c) Comparison between ARPES and first-principles calculations. The black and red lines denote the original and renormalized bands, respectively. (d) Spin excitation spectrum calculated using the renormalized band structure.
Go back by your web browser, or click the right button.áClose