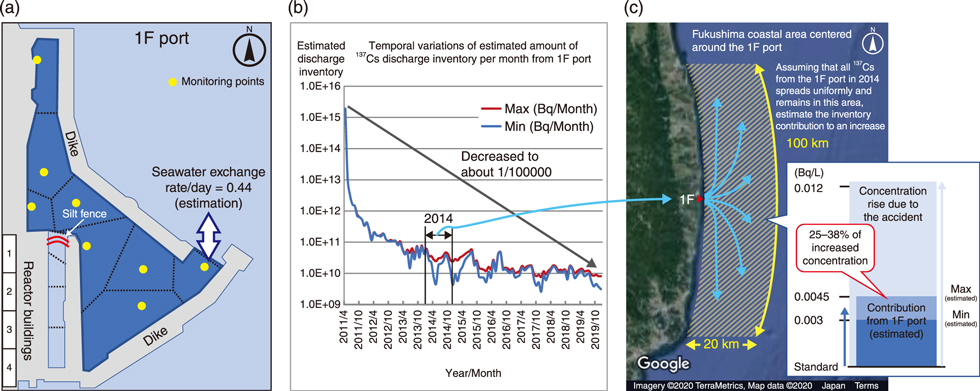
Fig.1-28 (a) Schematic of the Fukushima Daiichi NPS (1F) port, (b) temporal variations of estimated 137Cs discharge per month from the 1F port and (c) 20 km (east–west) and 100 km (north–south) coastal area around the 1F port
(a) The concentration of 137Cs in seawater has been monitored (yellow dots) inside the 1F port since 2013 and the concentration data have been published nearly every day. The black dotted lines represent the borders of the Voronoi cells obtained by using Voronoi tessellation for a set of the monitoring points. (b) The estimated monthly discharge decreased to approximately 1/100000th of that in the early stage of the accident. (c) Assuming that all 137Cs from the 1F port in 2014 spread uniformly and remains in the coastal area, the inventory discharge is estimated to contribute an increase of 0.003 to 0.0045 Bq/L. Since the observed concentration in the sea area was increased by 0.012 Bq/L due to the accident, the contribution of the 137Cs from the 1F port to the concentration rise is approximately 25% to 38%.
Go back by your web browser, or click the right button.« Close