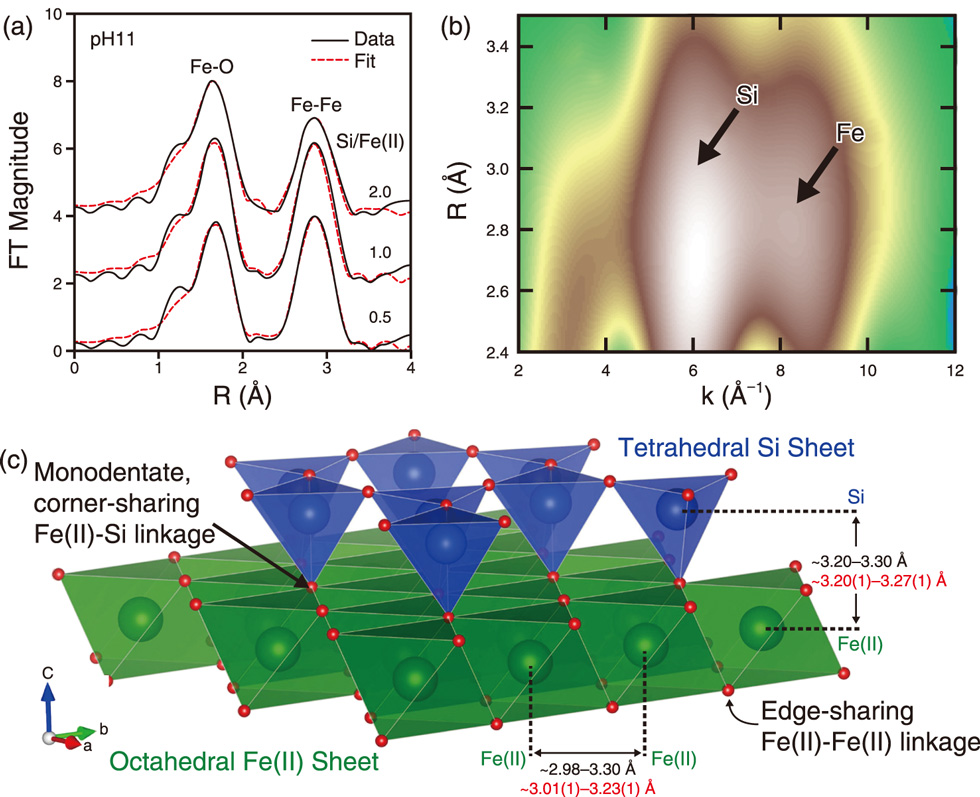
Fig.8-23 Local structure analyses using EXAFS
(a) Fourier transform of Fe K-edge EXAFS; fitting the spectra yields information on bond lengths and coordination numbers. (b) Wavelet transform of EXAFS showing bonding between Si and Fe. (c) Structural details derived from EXAFS analysis confirm the presence of a clay structure in the solids.
Go back by your web browser, or click the right button.« Close