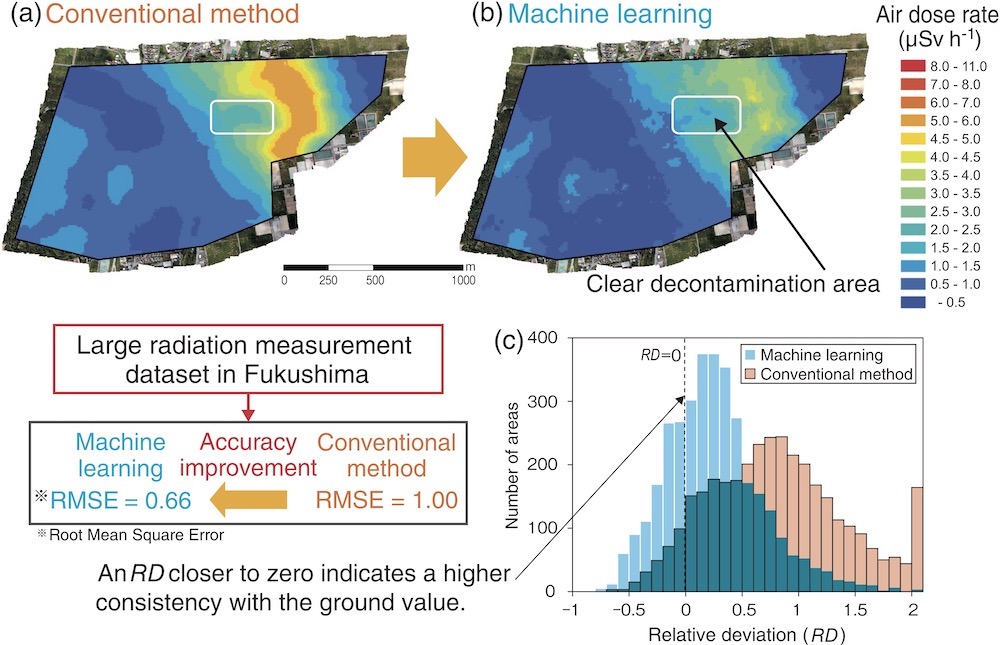
Fig.1-27 Air dose rate map converted by machine learning
Air dose rate map converted by (a) the conventional method and (b) the proposed machine-learning method using an ANN. (c) A histogram of the relative deviation (RD) between the simulated and measured value.
Go back by your web browser, or click the right button.« Close