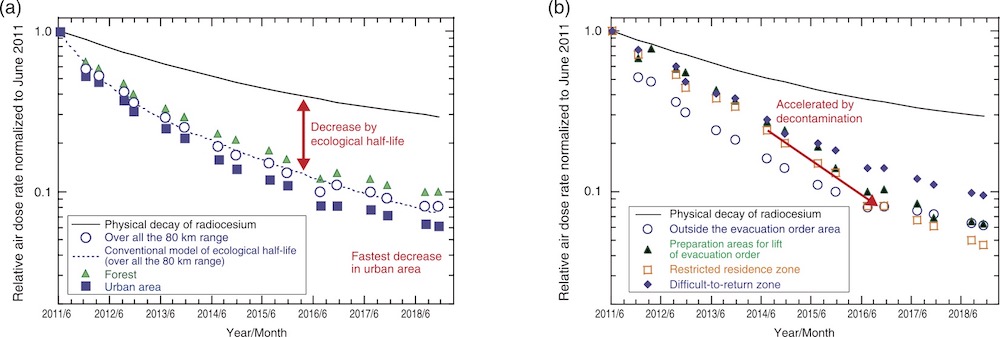
Fig.1-28 Decreasing trend in air dose rates by the car-borne surveys within 80 km of 1F
Relative air dose rates normalized to June 2011 are shown as for (a) over all regions within 80 km of 1F and land-use category, (b) dependence on the evacuation order areas (as for the urban area land-use category).
Go back by your web browser, or click the right button.« Close