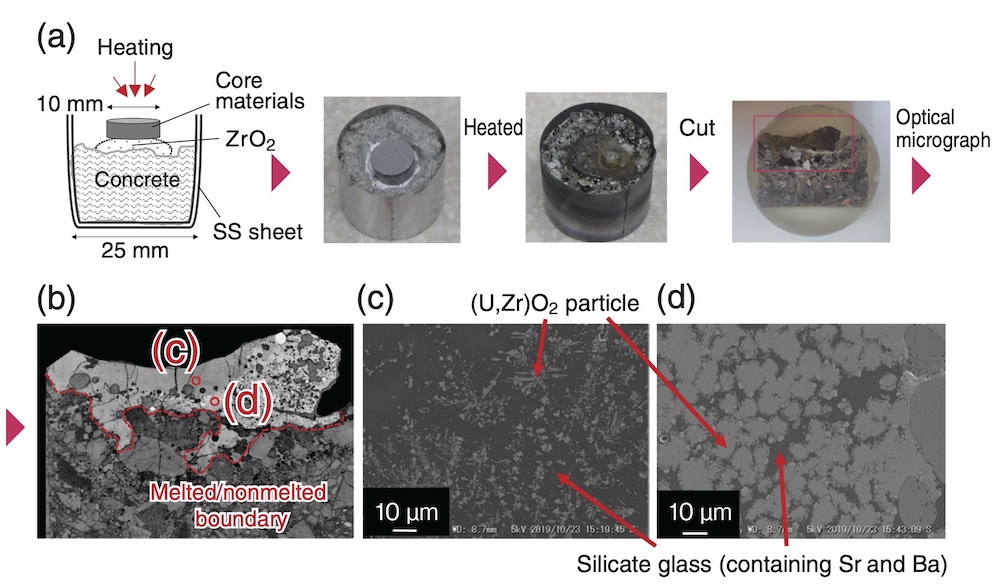
Fig.1-6 (a) Schematic image and appearance of simulated MCCI product, (b) optical micrograph of a cross section of the simulated MCCI product, (c) SEM image of the upper region in the once-melted zone, and (d) SEM image of the bottom region in the once-melted zone
Core materials mixture was placed on a piece of concrete and MCCI was simulated using a light-concentrated heating technique. The cross-sectional images of the once-melted zone show that dark silicate glass (containing Sr and Ba) is dominant in the upper region, while (U,Zr)O2 is rich in the bottom region.
Go back by your web browser, or click the right button.« Close