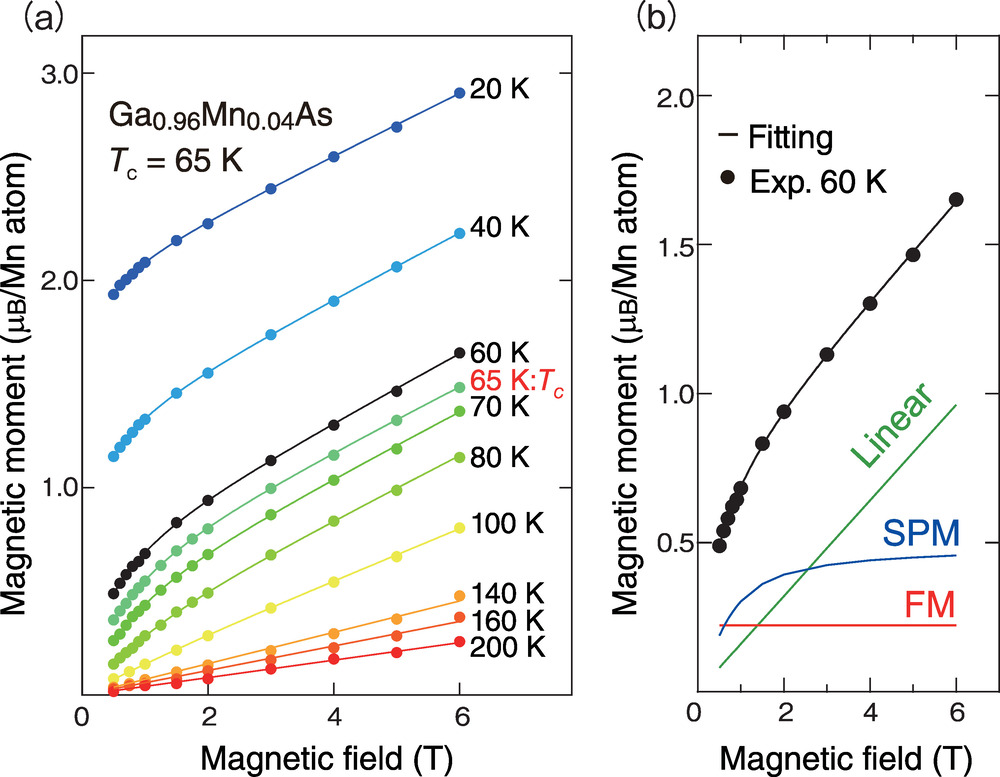
Fig.5-14 Temperature and magnetic field dependence of the XMCD for Ga0.96Mn0.04As
(a) Experimental and fitting results are represented by solid circles and lines, respectively. (b) Red, green and blue lines show the extracted FM, Linear magnetic, and SPM components, respectively; the black solid line shows the sum of these three components.
Go back by your web browser, or click the right button.« Close