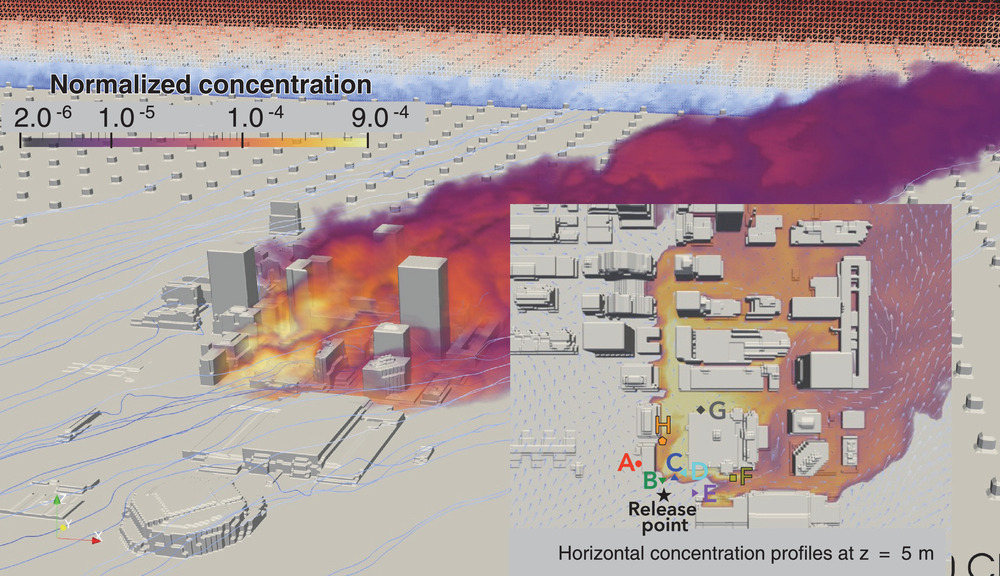
Fig.9-2 Visualization of buildings and concentration
The real-time simulation was performed over 4.2 × 4.2 × 2.5 km3 and reflected the meteorological conditions given by the mesoscale weather prediction model and building data in the city center.
Go back by your web browser, or click the right button.« Close