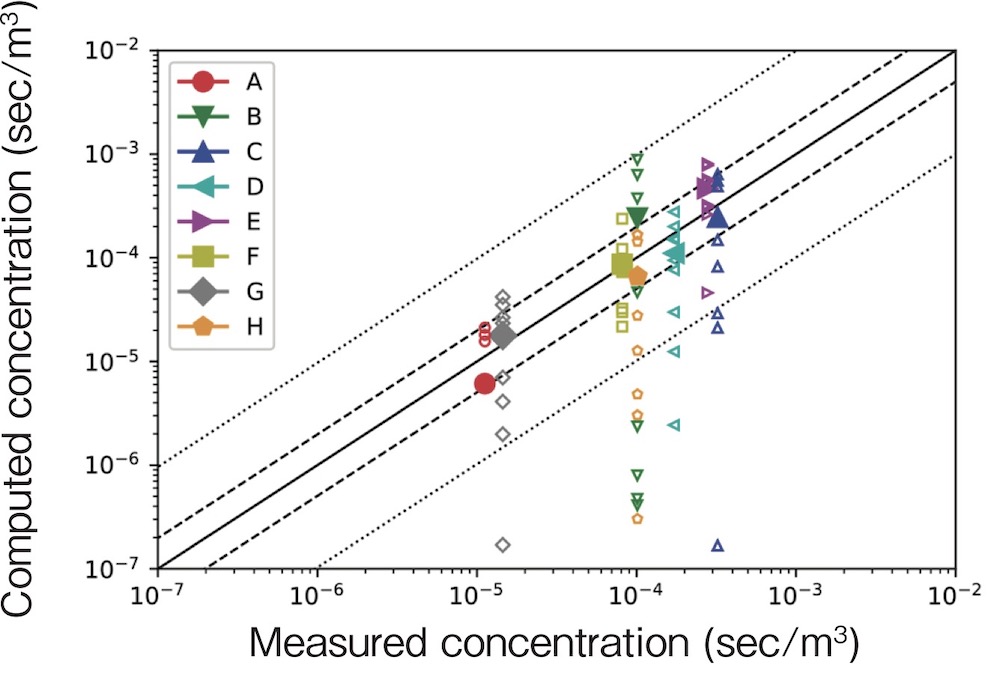
Fig.9-3 Mean concentration (scatter plots)
Open and solid symbols denote ensemble and ensemble-averaged data, respectively. The dashed and dotted lines represent factor-of-two and factor-of-ten agreement with the observations, respectively.
Go back by your web browser, or click the right button.« Close