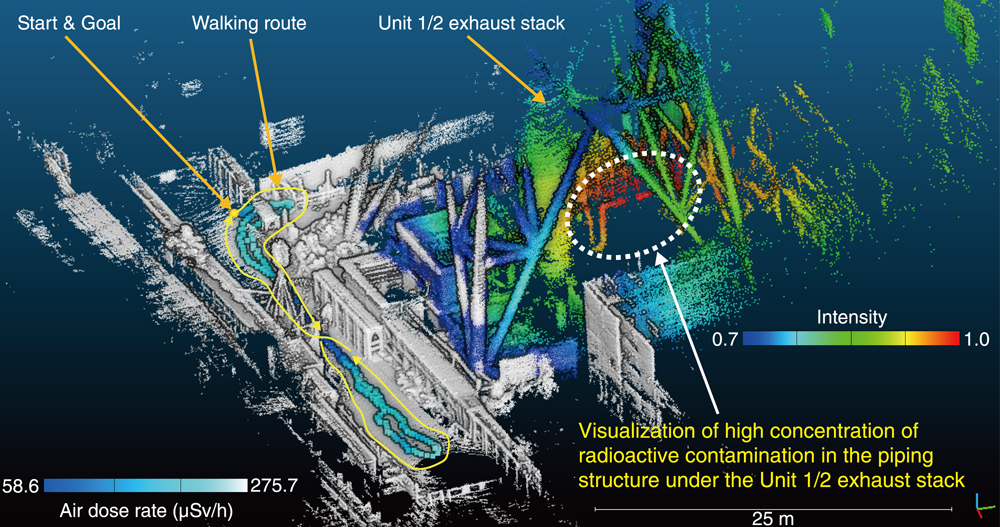
Fig.1-21 Three-dimensional (3D) map visualizing the air dose rate and highly contaminated region near Unit 1/2 exhaust stack at 1F
Image of a radioactive hotspot visualized by a Compton camera and dose rate information acquired by a survey meter are displayed in color on the 3D environment model acquired by the SLAM device incorporated in iRIS. The color display shows the dose rate along the walking route on the passageway (left in the figure) and the radioactive hotspot visualized by the Compton camera (right in the figure). The intensity of the color bar on the right side of the figure indicates that the closer the color is to red, the greater is the amount of radioactive substances accumulated. Using iRIS, it is possible to visualize radioactive contamination in three dimensions.
Go back by your web browser, or click the right button.« Close