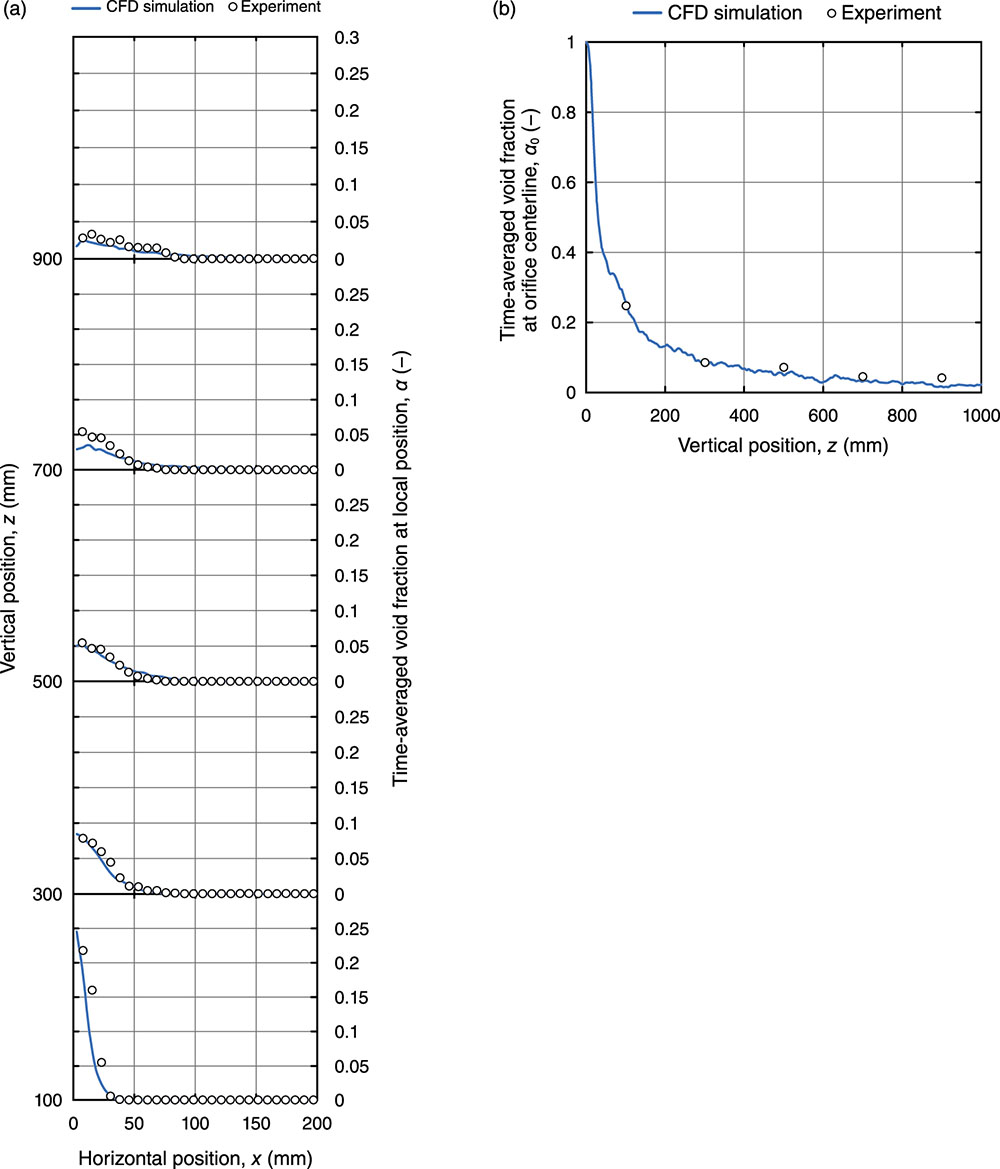
Fig.2 Time-averaged void fraction (gas volume fraction) distribution
(a) and (b) show the results in the horizontal and vertical directions, respectively. The solid lines and open circles represent the analytical values obtained by numerical simulation and the experimental values, respectively. The experimental values agree with analytical values.
Go back by your web browser, or click the right button.« Close