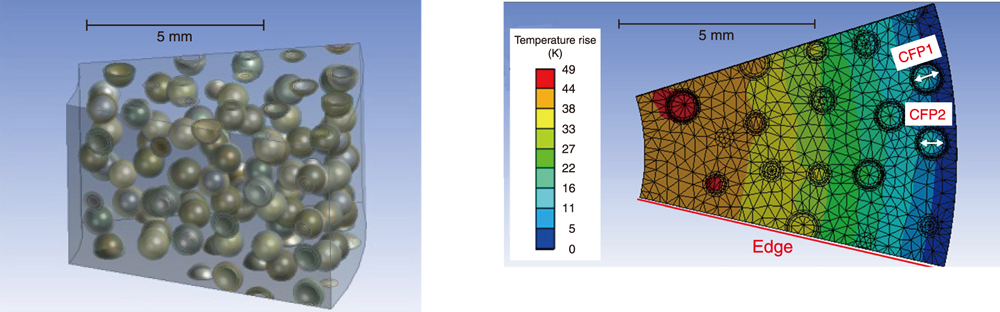
Fig.2 Computational model for thermal conduction evaluation in a fuel compact reproducing the actual heterogeneous CFP distribution (left) and the calculation results of temperature-rise distribution across the fuel compact (right)
The left figure shows a model extracted from the fuel compact at a height of 5 mm and an angle of 30°. The right figure shows the results of the temperature-rise distribution evaluation. The temperature gradient is especially large near the outer surface of the fuel compact (CFP1 and CFP2 in the figure), which results in the largest fuel kernel migration in this region.
Go back by your web browser, or click the right button.« Close