The volcanic gas contains such harmful materials as SO2, H2S, etc. Its behavior is, therefore, an important issue. In the study of environmental sciences, JAERI clarified the mechanism of its dispersion from Mt. Oyama at Miyake Island by simulation, and promptly started to forecast the volcanic gas behavior on the web site to call public attention to it.
For the simulation study of volcanic gas-behavior, the SPEEDI (System for Prediction of Environmental Emergency Dose Information) was applied. It consists of such advanced models as an atmospheric dynamic model, a concentration distribution model and others. The atmospheric dynamic model calculates the three-dimensional variation of wind velocity, temperature change and turbulence of atmosphere by use of the latest GPV (Grid Point Value) supplied from the Meteorological Agency. From the result obtained, the concentration distribution model automatically predicts the distributions of volcanic gas with weather changes.
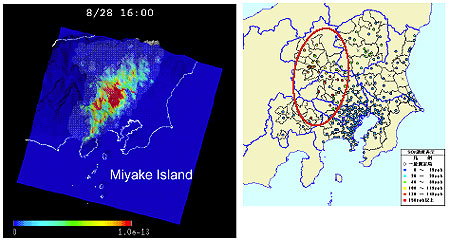
The mechanism of the stench incidents in west Kanto district on Aug. 28, 2000 was clarified by the simulation: The volcanic gas erupted from Mt. Oyama at dawn came to the west Kanto district with continuous east wind at a high attitude in the morning. Some part of the gas descended there due to the formation of a mixed layer with a temperature increase in the daytime. Thus, stench incidents were reported and gas monitors detected SO2 in the district. Figure 7-1 shows the results obtained by the simulation with those recorded by the monitors. They are in good agreement. The spray rate of SO2 from Mt. Oyama is around 2,500 metric ton/h by calculation.
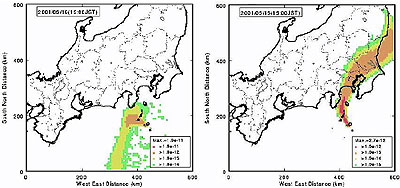
On the web site (http://des.tokai.jaeri.go.jp/), the forecast of volcanic gas behavior that has been obtained by the above-mentioned simulation,has been reported continually. Figure 7-2 shows examples of the forecast. Some similar application of the system can be expected for prediction of migration behavior of sands and planthoppers (noxious insects of rice) from China, analysis of the distribution behavior of pollutants in the environment, an assessment of site location effects of industries, etc. |