10. 2  Easy Development of a Computer Program in the Visual Environment
- A New Supporting System for Large-Scale Simulation


Fig. 10-4 Schematic diagram of the visual debugger

The system is composed of six subsystems, i.e., user interface, debugger server, debugger, data format subsystem, data merging subsystem, and visualization subsystem. By using the visual debugger users can debug programs interactively.


Fig. 10-5 An example of the visual output of the visual debugger used for debugging a fluid dynamics simulation program, which shows the flow around a wing placed in compressible gas in a wind tunnel. A difference of color corresponds to a difference of gas density. In this case an unnatural density change is observed and the existence of a program bug is suggested.


Fig. 10-6 The same program as one used for the example in Fig. 10-5 has been run on 2 different computers, i.e., IBM SP and SGI ONIX, and the difference data of the output data are displayed. At almost all points in the computational domain a difference of results by the two computers is observed. By using this kinds of information transplanting programs between different computers or parallelization of program is carried out effectively.


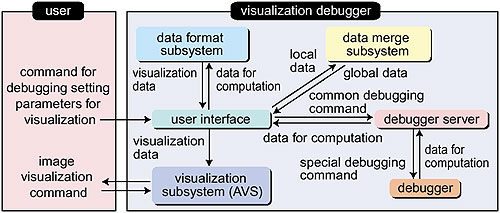
The debugging process is indispensable for developing a numerical program and conventionally computer systems furnish debuggers which output the necessary numerical data as a mass of numerals. It is, however, a laborious task to investigate such a mass of numerals for debugging a large-scale simulation program, and it is hard to say that such debuggers based on numerals can be used very effectively. In order to cope with the difficulty we have developed a visual debugger by combining the parallel debugger for the program of parallel computers and the visualization program with some new functions (Fig. 10-4). Though there are already debuggers called "visual debuggers,"
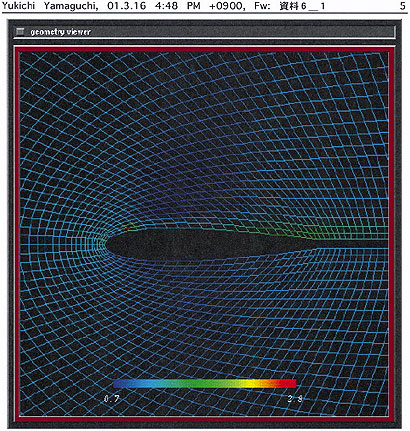
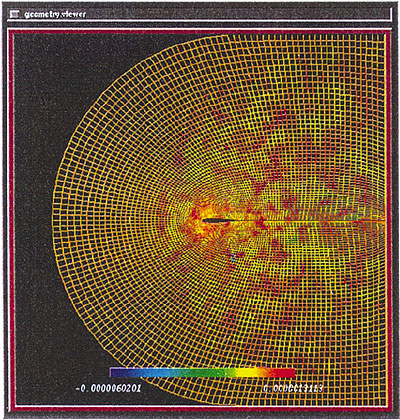
their function is only to show the numerals of components of vectors or matrices graphically. By using the new visual debugger, we can see the result of the simulation on the way. For example, if we are carrying out a numerical simulation of air flow in a wind tunnel, we can obtain a figure of a three-dimensional air flow as debugging data (Fig. 10-5). Consequently, physically unnatural points are discovered at first sight without laborious investigation of the mass of numerals. Moreover, when we transplant a simulation program from one computer to another or parallelize a program, we can obtain a visual display of difference data and the debugging task is carried out very effectively (Fig. 10-6).


Reference
K. Matsuda et al., Improvement of Visual Debugging Tool-Shortening the Elapsed Time for Getting Data and Adding New Functions to Compare/Combine a Set of Visualized Data-, JAERI-Data/Code 2001-003 (2001).

Select a topic in left column


Persistent Quest - Research Activities 2001
Copyright(c) Japan Atomic Energy Research Institute